


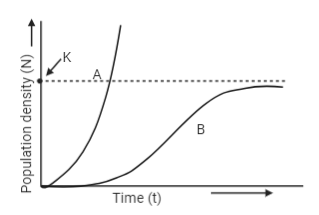
Study the population growth curves (A and B) in the given graph and select the incorrect option.
A. Curve ‘A’ shows exponential growth, represented by equation $\frac{dN}{dx}=rN$
B. Curve ‘B’ shows logistic growth, represented by equation $\frac{dN}{dx}=rN(\frac{K-N}{K})$
C. Exponential growth curve is considered as more realistic than the logistic growth curve
D. Curve ‘A’ can also be represented by equation \[{{N}_{t}}={{N}_{0}}{{e}^{r}}t\]
Answer
563.4k+ views
Hint: The Exponential growth curve and the logistic growth curve are used to explain the population growth. Growth of population is defined as the increase in the size of the population over a given time length. The growth rate is a term used to depict the change in the number of individuals in a particular population with time.
Complete answer: Exponential growth is the growth of a population whose population rate is proportional to the population size over a given time. Birth and death rate determine the size of a population. When resources are available in abundance for the individual in a population, then exponential growth occurs. The J-shaped curve in the graph represents the exponential growth curve. It represents that at the beginning the population size is small. But with time, the population size is increasing. Growth rate increases along with population growth. Exponential growth represents a fixed percentage rate of increase over a specific time. The logistic growth on the other hand refers to population growth whose growth rate decreases with increasing individuals. When the population reaches its maximum, it becomes zero. Limited food supply, limited resources, and space create competition among individuals of a population. Thus, it affects population growth. The rate of growth depends on population size. The sigmoid curve in eth graph represents the logistics curve. The population in such a case cannot exceed the carrying capacity of the environment. The carrying capacity of the environment is its capacity to sustain the maximum population. Since resources for most individuals of the population are finite and becomes limiting, the logistic growth curve is more realistic than the exponential growth curve.
So, the correct answer is option C.
Note: Logistic growth model can be applied to most of the population on Earth as it is more realistic. The exponential growth curve, on the other hand, is evident in the growth of the human population. The virus spreading is also an example of exponential growth until its vaccination is introduced.
Recently Updated Pages
Master Class 12 Economics: Engaging Questions & Answers for Success
Master Class 12 Physics: Engaging Questions & Answers for Success
Master Class 12 English: Engaging Questions & Answers for Success
Master Class 12 Social Science: Engaging Questions & Answers for Success
Master Class 12 Maths: Engaging Questions & Answers for Success
Master Class 12 Business Studies: Engaging Questions & Answers for Success
Trending doubts
Which are the Top 10 Largest Countries of the World?
What are the major means of transport Explain each class 12 social science CBSE
Draw a labelled sketch of the human eye class 12 physics CBSE
Why cannot DNA pass through cell membranes class 12 biology CBSE
Differentiate between insitu conservation and exsitu class 12 biology CBSE
Draw a neat and well labeled diagram of TS of ovary class 12 biology CBSE