


The area under velocity-time graph gives:
A. Acceleration
B. Distance
C. Displacement
D. velocity
Answer
598.8k+ views
Hint – You can start by describing the velocity-time graph. Draw a general graph as an example. Find out the area of the velocity-time. Then use the relation between velocity, time and displacement\[v = \dfrac{{dx}}{{dt}}\]. Then compare the area with the equation of displacement. Use this method to reach the solution.
Complete step-by-step answer:
Equations are useful for explaining idealized scenarios, but they don't always cut it. In many instances it is much more efficient to use an image to describe the situation. Graphs can be considered as a mathematical picture and describe real world events in a compact form. Graphs of motion are available for several types of situations based on which of the kinematic quantities (time, position, velocity, acceleration) are assigned to the X axis and the Y axis.
An example of a graph of velocity with respect to time is shown below.
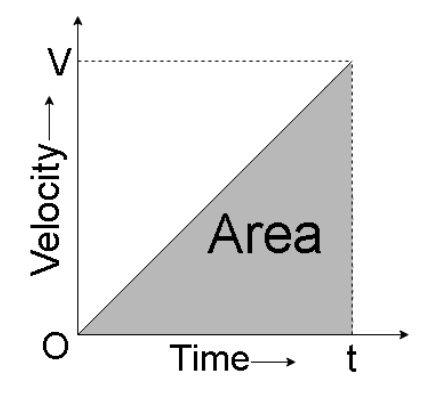
Here the velocity is plotted on X axis and time on the Y axis.
In the example we see that the area formed by the graph is in the shape of a right angles triangle, and we know for a right angled triangle
\[Area = \dfrac{1}{2} \times Height \times Base\]
\[ \Rightarrow Area = \dfrac{1}{2} \times velocity \times time\]
\[ \Rightarrow Area = \dfrac{1}{2}vt\](Equation 1)
We also know that the relation of displacement, time and velocity are
\[v = \dfrac{{dx}}{{dt}}\]
\[ \Rightarrow dx = vdt\]
Integrating both the sides, we get
\[ \Rightarrow \int {dx = } vdt\]
\[ \Rightarrow x = \int {vdt} \](Equation 2)
If we compare equation 1 and equation 2, we see that the area of the velocity-time graph represents the displacement of an object in that time frame.
In the example we used, the area is in the shape of a right angled triangle but whatever the shape of the area of the velocity-time graph, it is always equal to the displacement.
Note: The velocity-time graph is a very useful graph. You can find out the displacement of an object by calculating the area of the graph, additionally you can also find the average or instantaneous acceleration of the body, by using the following relations \[{a_{average}} = \dfrac{v}{t}\] and \[a = \dfrac{{dv}}{{dt}}\] respectively.
Complete step-by-step answer:
Equations are useful for explaining idealized scenarios, but they don't always cut it. In many instances it is much more efficient to use an image to describe the situation. Graphs can be considered as a mathematical picture and describe real world events in a compact form. Graphs of motion are available for several types of situations based on which of the kinematic quantities (time, position, velocity, acceleration) are assigned to the X axis and the Y axis.
An example of a graph of velocity with respect to time is shown below.
Here the velocity is plotted on X axis and time on the Y axis.
In the example we see that the area formed by the graph is in the shape of a right angles triangle, and we know for a right angled triangle
\[Area = \dfrac{1}{2} \times Height \times Base\]
\[ \Rightarrow Area = \dfrac{1}{2} \times velocity \times time\]
\[ \Rightarrow Area = \dfrac{1}{2}vt\](Equation 1)
We also know that the relation of displacement, time and velocity are
\[v = \dfrac{{dx}}{{dt}}\]
\[ \Rightarrow dx = vdt\]
Integrating both the sides, we get
\[ \Rightarrow \int {dx = } vdt\]
\[ \Rightarrow x = \int {vdt} \](Equation 2)
If we compare equation 1 and equation 2, we see that the area of the velocity-time graph represents the displacement of an object in that time frame.
In the example we used, the area is in the shape of a right angled triangle but whatever the shape of the area of the velocity-time graph, it is always equal to the displacement.
Note: The velocity-time graph is a very useful graph. You can find out the displacement of an object by calculating the area of the graph, additionally you can also find the average or instantaneous acceleration of the body, by using the following relations \[{a_{average}} = \dfrac{v}{t}\] and \[a = \dfrac{{dv}}{{dt}}\] respectively.
Recently Updated Pages
Master Class 11 Computer Science: Engaging Questions & Answers for Success
Master Class 11 Business Studies: Engaging Questions & Answers for Success
Master Class 11 Economics: Engaging Questions & Answers for Success
Master Class 11 English: Engaging Questions & Answers for Success
Master Class 11 Maths: Engaging Questions & Answers for Success
Master Class 11 Biology: Engaging Questions & Answers for Success
Trending doubts
One Metric ton is equal to kg A 10000 B 1000 C 100 class 11 physics CBSE
There are 720 permutations of the digits 1 2 3 4 5 class 11 maths CBSE
Discuss the various forms of bacteria class 11 biology CBSE
Draw a diagram of a plant cell and label at least eight class 11 biology CBSE
State the laws of reflection of light
Explain zero factorial class 11 maths CBSE