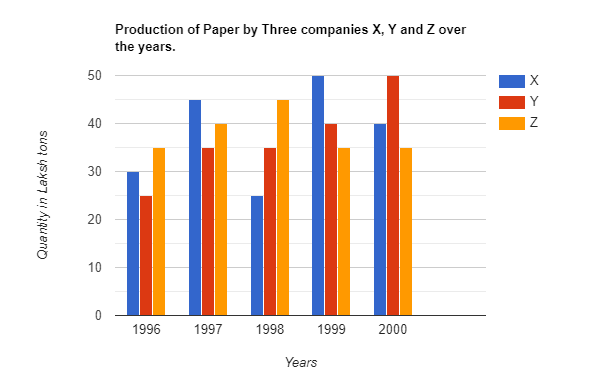
The average production for five years was the maximum for which company?

A. $X$
B. $Y$
C. $Z$
D. $X$ and $Z$ both

Answer
511.5k+ views
Hint: In this problem we need to find the company which is having the highest average over the given years. For this we will first consider each company and read the data related to the company from the given bar graph. After having all the data related to the company we will calculate the average by taking the ratio of total papers published to the number of years given. Like this we will calculate the average for all the three companies and compare them to know which company has the highest average of production.
Complete step by step answer:
Given bar graph is

Considering the company $X$ .
The company $X$has a production of $30$ laksh tons in $1996$ .
The company $X$has a production of $45$ laksh tons in $1997$ .
The company $X$has a production of $25$ laksh tons in $1998$ .
The company $X$has a production of $50$ laksh tons in $1999$ .
The company $X$has a production of $40$ laksh tons in $2000$ .
Total production is calculated by adding all the production, then we will have
$\begin{align}
& \text{Total}=30+45+25+50+40 \\
& \Rightarrow \text{Total}=190 \\
\end{align}$
Average production over $5$ years is given by
$\begin{align}
& \text{Av}{{\text{g}}_{X}}=\dfrac{190}{5} \\
& \Rightarrow \text{Av}{{\text{g}}_{X}}=38 \\
\end{align}$
Considering the company $Y$ .
The company $Y$has a production of $25$ laksh tons in $1996$ .
The company $Y$has a production of $35$ laksh tons in $1997$ .
The company $Y$has a production of $35$ laksh tons in $1998$ .
The company $Y$has a production of $40$ laksh tons in $1999$ .
The company $Y$has a production of $50$ laksh tons in $2000$ .
Total production is calculated by adding all the production, then we will have
$\begin{align}
& \text{Total}=25+35+35+40+50+40 \\
& \Rightarrow \text{Total}=185 \\
\end{align}$
Average production over $5$ years is given by
$\begin{align}
& \text{Av}{{\text{g}}_{Y}}=\dfrac{185}{5} \\
& \Rightarrow \text{Av}{{\text{g}}_{Y}}=37 \\
\end{align}$
Considering the company $Z$ .
The company $Z$has a production of $35$ laksh tons in $1996$ .
The company $Z$has a production of $40$ laksh tons in $1997$ .
The company $Z$has a production of $45$ laksh tons in $1998$ .
The company $Z$has a production of $35$ laksh tons in $1999$ .
The company $Z$has a production of $35$ laksh tons in $2000$ .
Total production is calculated by adding all the production, then we will have
$\begin{align}
& \text{Total}=35+40+45+35+35 \\
& \Rightarrow \text{Total}=190 \\
\end{align}$
Average production over $5$ years is given by
$\begin{align}
& \text{Av}{{\text{g}}_{Z}}=\dfrac{190}{5} \\
& \Rightarrow \text{Av}{{\text{g}}_{Z}}=38 \\
\end{align}$
On observing the averages of three companies we can say that the companies $X$ and $Z$has heights average.
So, the correct answer is “Option D”.
Note: In this problem they have only asked to calculate the averages of the three companies according to the given bar graph. Sometimes they may also ask to calculate the standard deviation of the data. For this we need to calculate the difference between each variable and the calculated mean and square all of them.
Complete step by step answer:
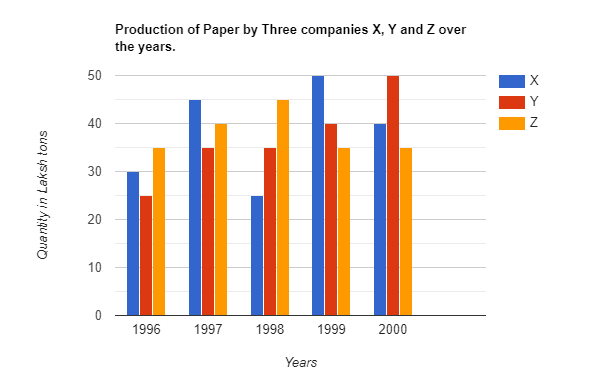
Given bar graph is

Considering the company $X$ .
The company $X$has a production of $30$ laksh tons in $1996$ .
The company $X$has a production of $45$ laksh tons in $1997$ .
The company $X$has a production of $25$ laksh tons in $1998$ .
The company $X$has a production of $50$ laksh tons in $1999$ .
The company $X$has a production of $40$ laksh tons in $2000$ .
Total production is calculated by adding all the production, then we will have
$\begin{align}
& \text{Total}=30+45+25+50+40 \\
& \Rightarrow \text{Total}=190 \\
\end{align}$
Average production over $5$ years is given by
$\begin{align}
& \text{Av}{{\text{g}}_{X}}=\dfrac{190}{5} \\
& \Rightarrow \text{Av}{{\text{g}}_{X}}=38 \\
\end{align}$
Considering the company $Y$ .
The company $Y$has a production of $25$ laksh tons in $1996$ .
The company $Y$has a production of $35$ laksh tons in $1997$ .
The company $Y$has a production of $35$ laksh tons in $1998$ .
The company $Y$has a production of $40$ laksh tons in $1999$ .
The company $Y$has a production of $50$ laksh tons in $2000$ .
Total production is calculated by adding all the production, then we will have
$\begin{align}
& \text{Total}=25+35+35+40+50+40 \\
& \Rightarrow \text{Total}=185 \\
\end{align}$
Average production over $5$ years is given by
$\begin{align}
& \text{Av}{{\text{g}}_{Y}}=\dfrac{185}{5} \\
& \Rightarrow \text{Av}{{\text{g}}_{Y}}=37 \\
\end{align}$
Considering the company $Z$ .
The company $Z$has a production of $35$ laksh tons in $1996$ .
The company $Z$has a production of $40$ laksh tons in $1997$ .
The company $Z$has a production of $45$ laksh tons in $1998$ .
The company $Z$has a production of $35$ laksh tons in $1999$ .
The company $Z$has a production of $35$ laksh tons in $2000$ .
Total production is calculated by adding all the production, then we will have
$\begin{align}
& \text{Total}=35+40+45+35+35 \\
& \Rightarrow \text{Total}=190 \\
\end{align}$
Average production over $5$ years is given by
$\begin{align}
& \text{Av}{{\text{g}}_{Z}}=\dfrac{190}{5} \\
& \Rightarrow \text{Av}{{\text{g}}_{Z}}=38 \\
\end{align}$
On observing the averages of three companies we can say that the companies $X$ and $Z$has heights average.
So, the correct answer is “Option D”.
Note: In this problem they have only asked to calculate the averages of the three companies according to the given bar graph. Sometimes they may also ask to calculate the standard deviation of the data. For this we need to calculate the difference between each variable and the calculated mean and square all of them.
Recently Updated Pages
Master Class 8 Social Science: Engaging Questions & Answers for Success

Master Class 8 English: Engaging Questions & Answers for Success

Class 8 Question and Answer - Your Ultimate Solutions Guide

Master Class 8 Maths: Engaging Questions & Answers for Success

Master Class 8 Science: Engaging Questions & Answers for Success

Master Class 7 English: Engaging Questions & Answers for Success

Trending doubts
What is BLO What is the full form of BLO class 8 social science CBSE

Citizens of India can vote at the age of A 18 years class 8 social science CBSE

Full form of STD, ISD and PCO

Advantages and disadvantages of science

Right to vote is a AFundamental Right BFundamental class 8 social science CBSE

What are the 12 elements of nature class 8 chemistry CBSE


