


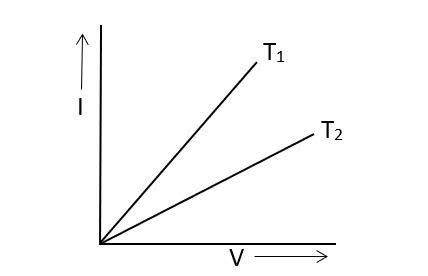
The current I and voltage V graphs for a given metallic wire of two different temperatures $T_1$ and $T_2$ which has been shown in the following figure. It is concluded that:
Answer
594.9k+ views
Hint: The inverse of the slope of the given graph gives us the resistance of a material at that point. We can thus understand the dependence of temperature on molecular level. As the two temperatures are different, their resistances will also be different.
Complete step by step answer:
In the given graph, the x-axis represents the voltage (V) and the y-axis represents the current (I). The graph has been plotted for a metallic wire at two different temperatures. If we take the inverse of the slope of the graph at any point, we will get the resistance of the wire.
According to Ohm’s law, we have $V=IR$, where V is the voltage, I is the current and R is the resistance. Upon rearranging the equation, we get $R=\dfrac{V}{I}\implies \dfrac{1}{R}=\dfrac{I}{V}$, which is the slope of the graph given.
From the graph, we can see that the slope of the graph at temperature $T_1$ is greater than that at temperature $T_2$. Now, we know that the resistivity of a metal increases, with increase in temperature and hence it’s resistance also increases. Since the material of the wire is the same, the resistance will be less at temperature $T_1$ than at $T_2$.
Hence, we can say that $T_2 > T_1$.
Note:
The movement or say bouncing of electrons and their frequency of collisions increases with the increase of temperature. The resistivity increases with temperature rise in case of metals. While in the case of insulators, the resistivity decreases with increase in temperature.
Recently Updated Pages
Master Class 12 Economics: Engaging Questions & Answers for Success
Master Class 12 Physics: Engaging Questions & Answers for Success
Master Class 12 English: Engaging Questions & Answers for Success
Master Class 12 Social Science: Engaging Questions & Answers for Success
Master Class 12 Maths: Engaging Questions & Answers for Success
Master Class 12 Business Studies: Engaging Questions & Answers for Success
Trending doubts
Which are the Top 10 Largest Countries of the World?
What are the major means of transport Explain each class 12 social science CBSE
Draw a labelled sketch of the human eye class 12 physics CBSE
Why cannot DNA pass through cell membranes class 12 biology CBSE
Differentiate between insitu conservation and exsitu class 12 biology CBSE
Draw a neat and well labeled diagram of TS of ovary class 12 biology CBSE