


The favorite flavors of ice cream for students of a school is given in percentages as follows. Represent this data by a pie chart.
Flavors Chocolate Vanilla Strawberry Other flavors Percentage of students preferring the flavors 40% 30% 20% 10%
| Flavors | Chocolate | Vanilla | Strawberry | Other flavors |
| Percentage of students preferring the flavors | 40% | 30% | 20% | 10% |
Answer
578.4k+ views
Hint: First of all, draw a circle. Since the percentage of the student having chocolate, vanilla, strawberry, and other flavor ice cream as their favorite are 40%, 30%, 20%, and 10% respectively, their contribution will also be 40%, 30%, 20%, and 10% respectively in the drawn circle.
Complete step-by-step solution:
According to the question, we have a table that shows the favorite flavors of ice cream for students of a school are given in percentages.
Now, after observing the table, we get
The percentages of the students who have chocolate flavor ice cream as their favorite = 40% ……………………………………………(1)
The percentages of the students who have vanilla flavor ice cream as their favorite = 30% ……………………………………………(2)
The percentages of the students who have strawberry flavor ice cream as their favorite = 20% ……………………………………………(3)
The percentages of the students who have other flavor ice cream as their favorite = 10% …………………………(4)
We have to represent this data using a pie chart.
First of all, let us draw a circle.
Since the percentage of the students having chocolate flavor ice cream as their favorite is 40% so, their contribution will also be 40% in the drawn circle.
Similarly, the percentage of the students having vanilla, strawberry, and other flavor ice cream as their favorite is 30%, 20%, and 10% respectively, so their contribution will also be in the drawn circle.
Now, using these data for drawing the pie chart,
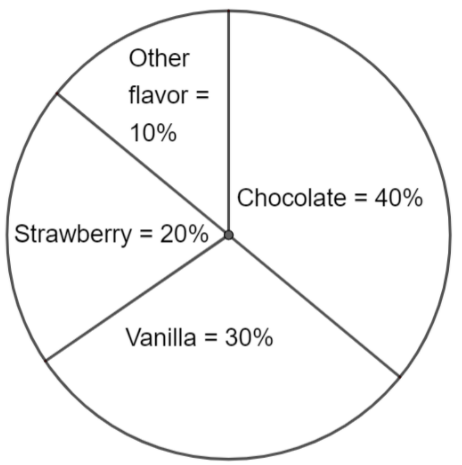
Hence, the above diagram is the required pie chart.
Note: To solve this type of question, keep the point in mind that a pie chart is a diagram consisting of a circle divided into parts that shows the size of a particular part with respect to the whole. Do not get it mistaken for a bar chart.
Complete step-by-step solution:
According to the question, we have a table that shows the favorite flavors of ice cream for students of a school are given in percentages.
Now, after observing the table, we get
The percentages of the students who have chocolate flavor ice cream as their favorite = 40% ……………………………………………(1)
The percentages of the students who have vanilla flavor ice cream as their favorite = 30% ……………………………………………(2)
The percentages of the students who have strawberry flavor ice cream as their favorite = 20% ……………………………………………(3)
The percentages of the students who have other flavor ice cream as their favorite = 10% …………………………(4)
We have to represent this data using a pie chart.
First of all, let us draw a circle.
Since the percentage of the students having chocolate flavor ice cream as their favorite is 40% so, their contribution will also be 40% in the drawn circle.
Similarly, the percentage of the students having vanilla, strawberry, and other flavor ice cream as their favorite is 30%, 20%, and 10% respectively, so their contribution will also be in the drawn circle.
Now, using these data for drawing the pie chart,
Hence, the above diagram is the required pie chart.
Note: To solve this type of question, keep the point in mind that a pie chart is a diagram consisting of a circle divided into parts that shows the size of a particular part with respect to the whole. Do not get it mistaken for a bar chart.
Recently Updated Pages
Master Class 10 Computer Science: Engaging Questions & Answers for Success
Master Class 10 General Knowledge: Engaging Questions & Answers for Success
Master Class 10 English: Engaging Questions & Answers for Success
Master Class 10 Social Science: Engaging Questions & Answers for Success
Master Class 10 Maths: Engaging Questions & Answers for Success
Master Class 10 Science: Engaging Questions & Answers for Success
Trending doubts
What is the median of the first 10 natural numbers class 10 maths CBSE
Which women's tennis player has 24 Grand Slam singles titles?
Who is the Brand Ambassador of Incredible India?
Why is there a time difference of about 5 hours between class 10 social science CBSE
Write a letter to the principal requesting him to grant class 10 english CBSE
A moving boat is observed from the top of a 150 m high class 10 maths CBSE