


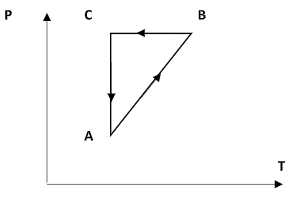
The figure given below shows a cyclic process on the P – T graph. Which of the following curves shows the same process on the P – V graph.
A)
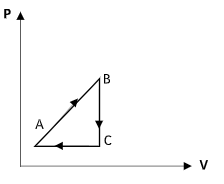
B)
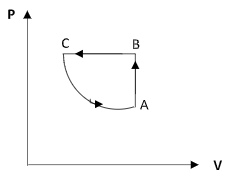
C)
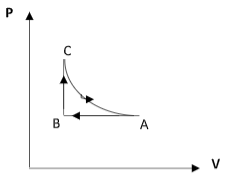
D)
Answer
579.9k+ views
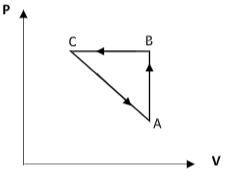
Hint: In the figure, AB represents an isochoric process, BC represents an isobaric process and CA represents an isothermal process. The volume of a system changes following the changes in temperature and pressure.
Complete step by step answer:
Step 1: Sketch the P – T diagram and explain each curve.
We know for an ideal gas, $\dfrac{{PV}}{T} = {\text{constant}}$ -------- (1).
Consider the curve AB. Here, as the temperature in the X-axis increases, the pressure in the Y-axis also increases. So, equation (1) suggests that the volume remains constant. Thus the curve AB is an isochoric process.
Consider the curve BC. Here, the temperature is made to decrease. But the pressure of the system remains constant. This implies that the curve BC represents an isobaric process.
From equation (1), $V = c \times T$ where $c$ is a constant that includes the constant value of pressure.
We get that the volume is proportional to temperature and therefore, the volume decreases along the curve BC.
Consider the curve CA. Here, the temperature is fixed and the pressure is observed to decrease. This implies that the curve CA is an isothermal process.
From equation (1) $V = \dfrac{d}{P}$ where $c$ is a constant that includes the constant value of temperature.
We get that the volume increases as the pressure drops. Therefore, for the curve CA, the volume increases.
Step 2: Sketch the P – V diagram of the cyclic process.

Therefore the correct option is option (B).
Note:
The increase in the volume as the pressure decreases will not be linear. Both options B and D show an increase in the volume along the curve CA but in option D, it is shown to be linear.
Complete step by step answer:
Step 1: Sketch the P – T diagram and explain each curve.
We know for an ideal gas, $\dfrac{{PV}}{T} = {\text{constant}}$ -------- (1).
Consider the curve AB. Here, as the temperature in the X-axis increases, the pressure in the Y-axis also increases. So, equation (1) suggests that the volume remains constant. Thus the curve AB is an isochoric process.
Consider the curve BC. Here, the temperature is made to decrease. But the pressure of the system remains constant. This implies that the curve BC represents an isobaric process.
From equation (1), $V = c \times T$ where $c$ is a constant that includes the constant value of pressure.
We get that the volume is proportional to temperature and therefore, the volume decreases along the curve BC.
Consider the curve CA. Here, the temperature is fixed and the pressure is observed to decrease. This implies that the curve CA is an isothermal process.
From equation (1) $V = \dfrac{d}{P}$ where $c$ is a constant that includes the constant value of temperature.
We get that the volume increases as the pressure drops. Therefore, for the curve CA, the volume increases.
Step 2: Sketch the P – V diagram of the cyclic process.
Therefore the correct option is option (B).
Note:
The increase in the volume as the pressure decreases will not be linear. Both options B and D show an increase in the volume along the curve CA but in option D, it is shown to be linear.
Recently Updated Pages
Master Class 11 Computer Science: Engaging Questions & Answers for Success
Master Class 11 Business Studies: Engaging Questions & Answers for Success
Master Class 11 Economics: Engaging Questions & Answers for Success
Master Class 11 English: Engaging Questions & Answers for Success
Master Class 11 Maths: Engaging Questions & Answers for Success
Master Class 11 Biology: Engaging Questions & Answers for Success
Trending doubts
One Metric ton is equal to kg A 10000 B 1000 C 100 class 11 physics CBSE
There are 720 permutations of the digits 1 2 3 4 5 class 11 maths CBSE
Discuss the various forms of bacteria class 11 biology CBSE
Draw a diagram of a plant cell and label at least eight class 11 biology CBSE
State the laws of reflection of light
Explain zero factorial class 11 maths CBSE