


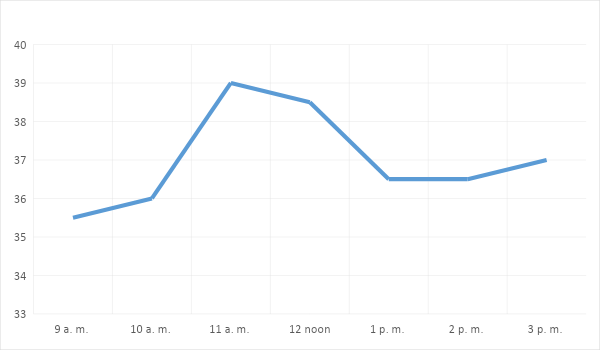
The following graph shows the temperature of a patient in a hospital, recorded every hour.
(i) What was the patient’s temperature at 1 p.m.?
(ii) When was the patient’s temperature 38.5oC?
(iii) The patient’s temperature was the same two times during the period given.
What were these two times?
(iv) What was the temperature at 1:30p.m.? How did you arrive at your answer?
(v) During which periods did the patient temperature show an upward trend?
Answer
573.6k+ views
Hint: These are the questions based on the chart u have to answer according to what is asked by seeing in the graph as shown in above figure i.e on x-axis it represents time period \[\left( {a.m.{\rm{ or p}}{\rm{.m}}{\rm{.}}} \right)\] and on y-axis it represents temperature \[\left( {^ \circ C} \right)\]
Complete step-by-step answer:
Let us begin with the questions by observing the chart.
(i)What was the patient’s temperature at 1 p.m.?
Here , from the above graph we can clearly see that at 1 p.m. the temperature of the patient on the graph is observed as \[{36.5^ \circ }C\].
So, the patient’s temperature at 1 p.m. was \[{36.5^ \circ }C\] .
(ii)When was the patient’s temperature 38.5oC?
As, it is clearly seen from the graph that at 12 noon the patient's temperature was 38.5oC.
(iii)The patient’s temperature was the same two times during the period given.
What were these two times?
As, it is visible from the graph that the patient’s temperature decreases from \[{38.5^ \circ }C\] to \[{36.5^ \circ }C\] at 1 p.m. and remains constant till 2 p.m. i.e same. \[\left( {{{36.5}^ \circ }C} \right)\]
(iv)What was the temperature at 1:30p.m.? How did you arrive at your answer?
As, we know that the patient’s temperature was constant between 1 p.m. to 2 p.m. and remained the same i.e \[{36.5^ \circ }C\]. That’s why the temperature at 1:30p.m. will remain the same i.e \[{36.5^ \circ }C\].
(v) During which periods did the patient temperature show an upward trend?
As, by observing the graph the patient temperature starts rising from 10a.m. to 11a.m.
Therefore, it showed an upward trend.
Note: These questions are based on observing the calculation and clearly understand what the graph says and give answers accordingly. We should check for the interval difference to get exact and accurate.
Recently Updated Pages
Master Class 10 Computer Science: Engaging Questions & Answers for Success
Master Class 10 General Knowledge: Engaging Questions & Answers for Success
Master Class 10 English: Engaging Questions & Answers for Success
Master Class 10 Social Science: Engaging Questions & Answers for Success
Master Class 10 Maths: Engaging Questions & Answers for Success
Master Class 10 Science: Engaging Questions & Answers for Success
Trending doubts
What is the median of the first 10 natural numbers class 10 maths CBSE
Which women's tennis player has 24 Grand Slam singles titles?
Who is the Brand Ambassador of Incredible India?
Why is there a time difference of about 5 hours between class 10 social science CBSE
Write a letter to the principal requesting him to grant class 10 english CBSE
State and prove converse of BPT Basic Proportionality class 10 maths CBSE