


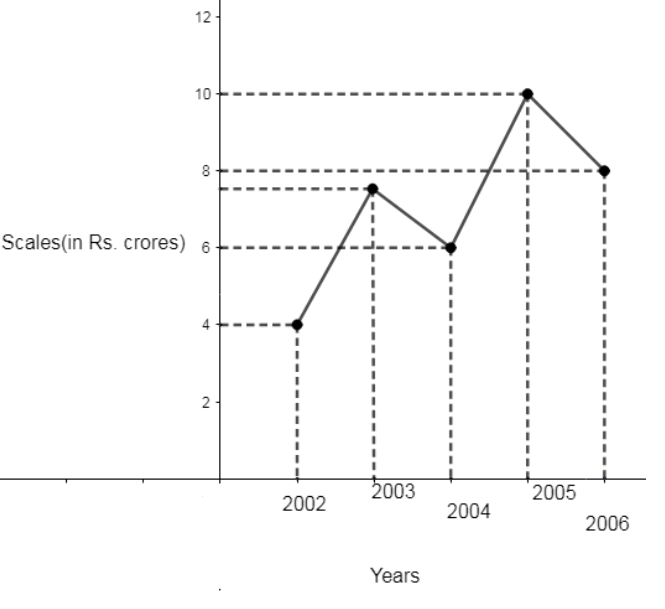
The following line graph shows the yearly sales figures for a manufacturing company.
(a) What were the sales in (i) 2002 (ii) 2006?
(b) What were the sales in (i) 2003 (ii) 2005?
(c) Compute the difference between sales in 2002 and 2006.
(d) In which year was the greatest difference between the sales as compared to its previous year.
Answer
576k+ views
Hint: For part (a) and (b) of the given question, check the point matching with the number of y-axes, i.e. sales axis.
For part (c) of the given question, subtract the sale in the year 2002 from the sale in the year 2006.
For part (d) of the given question, find the difference in sales in the year, 2002 – 2003, 2003 – 2004, 2004 – 2005 and 2005 – 2006, one – by – one. Now, check the year gap in which the difference is greatest.
Complete step-by-step solution:
We have been given the following graph: -

On the x-axis, we have been provided with years and on the y-axis, we have been given sales (in Rs. crores). Now, let us find the answers to all the four questions one – by – one.
(a) Here, we have to find the sales in the year 2002 and 2006.
(i) On observing the graph carefully, we see that in the year 2002 the sales (in crore Rs.) is 4 because the point lies in front of 4, on the y-axis.
(ii) On observing the graph, we see that in the year 2006 the sales (in crore Rs.) is 8 because the point lies in front of 8, on the y-axis.
(b) Here, we have to find the sales in 2003 and 2005.
(i) On observing the graph, we see that in the year 2003 the sales (in crore Rs.) are 7 because the point lies in between 6 and 8 on the y-axis.
(ii) On observing the graph, we see that in the year 2005, the sales (in crore Rs.) is 10, because the point lies in front of 10, on the y-axis.
(c) Here, we have to find the difference in sales in the year 2002 and 2006. Therefore,
Sales (in crore Rs.) in the year 2002 = 4
Sales (in crore Rs.) in the year 2006 = 8
So, the difference in the sales in these, two years = 8 – 4 = 4
(d) Here, we have to find the year in which there was the greatest difference in sales as compared to its previous year. Therefore, we have,
Difference in the sales (in crore Rs.) in the year 2002 – 2003 = 7 – 4 = 3.
Difference in the sales (in crore Rs.) in the year 2003 – 2004 = 7 – 6 = 1.
Difference in the sales (in crore Rs.) in the year 2004 – 2005 = 10 – 6 = 4.
Difference in the sales (in crore Rs.) in the year 2005 – 2006 = 10 – 8 = 2.
On observing the above results, we conclude that the greatest difference in sales is in the years 2004 and 2005.
Note: One may note that we have to consider the difference in sales as a positive number. That is why when we solve part (d) of the given question, we subtract the year having fewer sales from the year having more sales so that the difference remains positive. Always remember that we have to look for points carefully otherwise we may answer the wrong point.
For part (c) of the given question, subtract the sale in the year 2002 from the sale in the year 2006.
For part (d) of the given question, find the difference in sales in the year, 2002 – 2003, 2003 – 2004, 2004 – 2005 and 2005 – 2006, one – by – one. Now, check the year gap in which the difference is greatest.
Complete step-by-step solution:
We have been given the following graph: -
On the x-axis, we have been provided with years and on the y-axis, we have been given sales (in Rs. crores). Now, let us find the answers to all the four questions one – by – one.
(a) Here, we have to find the sales in the year 2002 and 2006.
(i) On observing the graph carefully, we see that in the year 2002 the sales (in crore Rs.) is 4 because the point lies in front of 4, on the y-axis.
(ii) On observing the graph, we see that in the year 2006 the sales (in crore Rs.) is 8 because the point lies in front of 8, on the y-axis.
(b) Here, we have to find the sales in 2003 and 2005.
(i) On observing the graph, we see that in the year 2003 the sales (in crore Rs.) are 7 because the point lies in between 6 and 8 on the y-axis.
(ii) On observing the graph, we see that in the year 2005, the sales (in crore Rs.) is 10, because the point lies in front of 10, on the y-axis.
(c) Here, we have to find the difference in sales in the year 2002 and 2006. Therefore,
Sales (in crore Rs.) in the year 2002 = 4
Sales (in crore Rs.) in the year 2006 = 8
So, the difference in the sales in these, two years = 8 – 4 = 4
(d) Here, we have to find the year in which there was the greatest difference in sales as compared to its previous year. Therefore, we have,
Difference in the sales (in crore Rs.) in the year 2002 – 2003 = 7 – 4 = 3.
Difference in the sales (in crore Rs.) in the year 2003 – 2004 = 7 – 6 = 1.
Difference in the sales (in crore Rs.) in the year 2004 – 2005 = 10 – 6 = 4.
Difference in the sales (in crore Rs.) in the year 2005 – 2006 = 10 – 8 = 2.
On observing the above results, we conclude that the greatest difference in sales is in the years 2004 and 2005.
Note: One may note that we have to consider the difference in sales as a positive number. That is why when we solve part (d) of the given question, we subtract the year having fewer sales from the year having more sales so that the difference remains positive. Always remember that we have to look for points carefully otherwise we may answer the wrong point.
Recently Updated Pages
Master Class 10 Computer Science: Engaging Questions & Answers for Success
Master Class 10 General Knowledge: Engaging Questions & Answers for Success
Master Class 10 English: Engaging Questions & Answers for Success
Master Class 10 Social Science: Engaging Questions & Answers for Success
Master Class 10 Maths: Engaging Questions & Answers for Success
Master Class 10 Science: Engaging Questions & Answers for Success
Trending doubts
What is the median of the first 10 natural numbers class 10 maths CBSE
Which women's tennis player has 24 Grand Slam singles titles?
Who is the Brand Ambassador of Incredible India?
Why is there a time difference of about 5 hours between class 10 social science CBSE
Write a letter to the principal requesting him to grant class 10 english CBSE
A moving boat is observed from the top of a 150 m high class 10 maths CBSE