


The function \[f\] is defined by
\[f(x) = \left\{
1 - x,x < 0 \\
1,x = 0 \\
x + 1,x > 0 \\
\right.\] .
Draw the graph of \[f(x)\] .
Answer
520.8k+ views
Hint: A function is nothing but an expression which defines a relationship between the independent variable and the dependent variable. For instance, let us consider a function \[f(x) = y\] , here \[y\] is the dependent variable and \[x\] is the independent variable. The variable \[y\] will get a value for each value of \[x\] .
Complete step by step answer:
It is given that \[f(x) = \left\{
1 - x,x < 0 \\
1,x = 0 \\
x + 1,x > 0 \\
\right.\]
that is,
When \[x < 0\] , \[f(x) = 1 - x\]
When \[x = 0\] , \[f(x) = 1\]
When \[x > 0\] , \[f(x) = x + 1\]
First, we have to find the points from the given function.
It is given that, when \[x < 0\] , \[f(x) = 1 - x\] , so \[x\] can take values like \[x = - 1, - 2, - 3, - 4,...\] .
Let’s substitute the values of \[x\] in the function.
For \[x = - 1\] , \[f( - 1) = 1 - ( - 1) = 1 + 1 = 2\] . So, the point is \[( - 1,2)\] .
For \[x = - 2\] , \[f( - 2) = 1 - ( - 2) = 1 + 2 = 3\] . So, the point is \[( - 2,3)\] .
For \[x = - 3\] , \[f( - 3) = 1 - ( - 3) = 1 + 3 = 4\] . So, the point is \[( - 3,4)\] .
For \[x = - 4\] , \[f( - 4) = 1 - ( - 4) = 1 + 4 = 5\] . So, the point is \[( - 4,5)\] .
We can keep on finding the point since there is no limit for the \[x\] value, so we will stop here. Let us find the points for the next condition.
It is given that, when \[x = 0\] , \[f(x) = 1\] . Here \[x\] has only one value that is 0, so \[f(0) = 1\] . So, the point is \[(0,1)\] .
Now let us find the points for the next condition.
It is given that, when \[x > 0\] , \[f(x) = x + 1\] , so \[x\] can take values like \[x = 1,2,3,4,...\] .
Let’s substitute the values of \[x\] in the function.
For \[x = 1\] , \[f(1) = 1 + 1 = 2\] . So, the point is \[(1,2)\] .
For \[x = 2\] , \[f(2) = 2 + 1 = 3\] . So, the point is \[(2,3)\] .
For \[x = 3\] , \[f(3) = 3 + 1 = 4\] . So, the point is \[(3,4)\] .
For \[x = 4\] , \[f(4) = 4 + 1 = 5\] . So, the point is \[(4,5)\] .
Now let’s plot these points in the graph with the scale \[x\] axis \[1unit = 1cm\] and \[y\] axis \[1unit = 1cm\] and join the points.
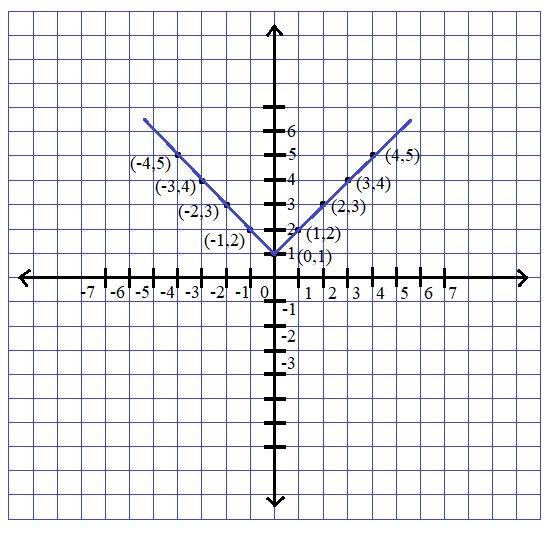
This is the required graph for the given function.
Note: Since the condition of the given problem doesn’t have any limit point, we have found some points to plot it in the graph. Point to remember while drawing graph: Scale of the graph is important; it has to be uniform. The given function doesn’t stop anywhere since \[x\] has indefinite values, we will be getting a value of \[y\] for each value of \[x\] .
Complete step by step answer:
It is given that \[f(x) = \left\{
1 - x,x < 0 \\
1,x = 0 \\
x + 1,x > 0 \\
\right.\]
that is,
When \[x < 0\] , \[f(x) = 1 - x\]
When \[x = 0\] , \[f(x) = 1\]
When \[x > 0\] , \[f(x) = x + 1\]
First, we have to find the points from the given function.
It is given that, when \[x < 0\] , \[f(x) = 1 - x\] , so \[x\] can take values like \[x = - 1, - 2, - 3, - 4,...\] .
Let’s substitute the values of \[x\] in the function.
For \[x = - 1\] , \[f( - 1) = 1 - ( - 1) = 1 + 1 = 2\] . So, the point is \[( - 1,2)\] .
For \[x = - 2\] , \[f( - 2) = 1 - ( - 2) = 1 + 2 = 3\] . So, the point is \[( - 2,3)\] .
For \[x = - 3\] , \[f( - 3) = 1 - ( - 3) = 1 + 3 = 4\] . So, the point is \[( - 3,4)\] .
For \[x = - 4\] , \[f( - 4) = 1 - ( - 4) = 1 + 4 = 5\] . So, the point is \[( - 4,5)\] .
We can keep on finding the point since there is no limit for the \[x\] value, so we will stop here. Let us find the points for the next condition.
It is given that, when \[x = 0\] , \[f(x) = 1\] . Here \[x\] has only one value that is 0, so \[f(0) = 1\] . So, the point is \[(0,1)\] .
Now let us find the points for the next condition.
It is given that, when \[x > 0\] , \[f(x) = x + 1\] , so \[x\] can take values like \[x = 1,2,3,4,...\] .
Let’s substitute the values of \[x\] in the function.
For \[x = 1\] , \[f(1) = 1 + 1 = 2\] . So, the point is \[(1,2)\] .
For \[x = 2\] , \[f(2) = 2 + 1 = 3\] . So, the point is \[(2,3)\] .
For \[x = 3\] , \[f(3) = 3 + 1 = 4\] . So, the point is \[(3,4)\] .
For \[x = 4\] , \[f(4) = 4 + 1 = 5\] . So, the point is \[(4,5)\] .
Now let’s plot these points in the graph with the scale \[x\] axis \[1unit = 1cm\] and \[y\] axis \[1unit = 1cm\] and join the points.
This is the required graph for the given function.
Note: Since the condition of the given problem doesn’t have any limit point, we have found some points to plot it in the graph. Point to remember while drawing graph: Scale of the graph is important; it has to be uniform. The given function doesn’t stop anywhere since \[x\] has indefinite values, we will be getting a value of \[y\] for each value of \[x\] .
Recently Updated Pages
Master Class 11 Computer Science: Engaging Questions & Answers for Success
Master Class 11 Business Studies: Engaging Questions & Answers for Success
Master Class 11 Economics: Engaging Questions & Answers for Success
Master Class 11 English: Engaging Questions & Answers for Success
Master Class 11 Maths: Engaging Questions & Answers for Success
Master Class 11 Biology: Engaging Questions & Answers for Success
Trending doubts
One Metric ton is equal to kg A 10000 B 1000 C 100 class 11 physics CBSE
There are 720 permutations of the digits 1 2 3 4 5 class 11 maths CBSE
Discuss the various forms of bacteria class 11 biology CBSE
Draw a diagram of a plant cell and label at least eight class 11 biology CBSE
State the laws of reflection of light
Explain zero factorial class 11 maths CBSE