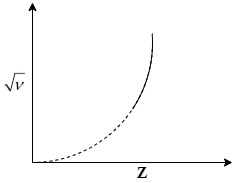
The graph between the square root of the frequency of a specific line of characteristic spectrum of X-ray and the atomic number of the target will be
a)

b)

c)

d)


Answer
587.1k+ views
Hint:It has been observed that the frequency of the characteristic spectrum of X-ray and the atomic number of the target is dependent in such a way that the frequency is proportional to the square of the atomic number with an offset value.
Formula used:
Relationship between the frequency of characteristic spectrum of X-ray and the atomic number is given by:
$\nu = a{(Z - b)^2}$...................(1)
Where,
$\nu $ is the frequency of characteristic spectrum of X-ray,
Z denotes the atomic number of the target atom,
a is the proportionality constant and a is positive,
b is offset constant and it’s positive also.
Complete step by step answer:
From eq.(1) we get the relationship between$\sqrt \nu $and Z as:
$
\nu = a{(Z - b)^2} \\
\therefore \sqrt \nu = \sqrt a Z - \sqrt a b \\
$.............................(2)
Now, compare this eq.(2) with the equation of a straight line i.e. $y = mx + c$. You will see that$\sqrt \nu $and Z are linearly related to each other with slope$\sqrt a $with an intercept $ - \sqrt a b$. So, the line will cut x-axis at +b point. Hence, the graph of $\sqrt \nu $ vs Z will look like:

Where, square roots of frequency values are given at y axis and the atomic number Z is given in the x-axis.
Correct answer:
The correct graph is given in option (b).
Note: From the given relation between frequency of characteristic spectrum and atomic number in eq.(1) a student can easily determine that the relationship between$\sqrt \nu $and Z will be linear. But they might get confused when choosing one between the first 3 straight line options. So, you need to focus on eq.(2). You will see that the line must have a negative intercept with y-axis. But in option a and option c the intercepts are positive and zero respectively. So, you’ll get the correct answer as graph b.
Formula used:
Relationship between the frequency of characteristic spectrum of X-ray and the atomic number is given by:
$\nu = a{(Z - b)^2}$...................(1)
Where,
$\nu $ is the frequency of characteristic spectrum of X-ray,
Z denotes the atomic number of the target atom,
a is the proportionality constant and a is positive,
b is offset constant and it’s positive also.
Complete step by step answer:
From eq.(1) we get the relationship between$\sqrt \nu $and Z as:
$
\nu = a{(Z - b)^2} \\
\therefore \sqrt \nu = \sqrt a Z - \sqrt a b \\
$.............................(2)
Now, compare this eq.(2) with the equation of a straight line i.e. $y = mx + c$. You will see that$\sqrt \nu $and Z are linearly related to each other with slope$\sqrt a $with an intercept $ - \sqrt a b$. So, the line will cut x-axis at +b point. Hence, the graph of $\sqrt \nu $ vs Z will look like:

Where, square roots of frequency values are given at y axis and the atomic number Z is given in the x-axis.
Correct answer:
The correct graph is given in option (b).
Note: From the given relation between frequency of characteristic spectrum and atomic number in eq.(1) a student can easily determine that the relationship between$\sqrt \nu $and Z will be linear. But they might get confused when choosing one between the first 3 straight line options. So, you need to focus on eq.(2). You will see that the line must have a negative intercept with y-axis. But in option a and option c the intercepts are positive and zero respectively. So, you’ll get the correct answer as graph b.
Recently Updated Pages
Master Class 11 Computer Science: Engaging Questions & Answers for Success

Master Class 11 Business Studies: Engaging Questions & Answers for Success

Master Class 11 Economics: Engaging Questions & Answers for Success

Master Class 11 English: Engaging Questions & Answers for Success

Master Class 11 Maths: Engaging Questions & Answers for Success

Master Class 11 Biology: Engaging Questions & Answers for Success

Trending doubts
One Metric ton is equal to kg A 10000 B 1000 C 100 class 11 physics CBSE

There are 720 permutations of the digits 1 2 3 4 5 class 11 maths CBSE

Discuss the various forms of bacteria class 11 biology CBSE

Draw a diagram of a plant cell and label at least eight class 11 biology CBSE

State the laws of reflection of light

Explain zero factorial class 11 maths CBSE


