


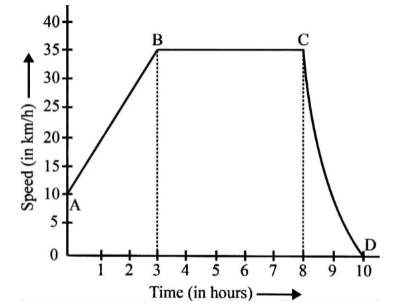
The graph given alongside shows how the speed of the car changes with time.
(i) What is the initial speed of the car?
(ii) What is the maximum speed attained by car?
(iii) Which part of the graph shows zero acceleration?
(iv) Which part of the graph shows varying retardation?
(v) Find the distance travelled in the first 8 hours.
Answer
502.5k+ views
Hint:When representing the movement of an object, speed-time graphs are quite useful. They can be used to determine whether an object is moving or not at any given time. They can also be used to determine the speed at which an object is moving at any given time. We can calculate any acceleration, change in speed, and change in time using data from the graph. We can also utilise graphs to figure out how far we've travelled. The distance travelled is represented by the area under a speed-time graph.
Complete step by step answer:
(i) The car's initial speed is the speed at \[t = 0\] . As a result, the speed is \[10{\text{ }}km{h^{ - 1}}\] .
(ii) The maximum speed is \[35km{h^{ - 1}}\] . Look at points B and C.
(iii) Because the car's speed does not change with time, B to C exhibits zero acceleration.
(iv) Because the speed of the component from C to D does not decrease uniformly with time, it shows variable retardation. (You can see that we have uniform acceleration from part A to part B.)
(v) You must compute the area below AB and BC, which is, to determine the distance travelled in the first 8 hours.
$\Rightarrow \left( {35 - 10} \right) \times \dfrac{3}{2} + 35 \times 5 \\
\Rightarrow 37.5 + 175 = 212.5km \\ $
You can also use the equations of motion to figure it out. Let me use the equations of motion to compute the distance between A and B.
Initial velocity $\left( u \right) = 10\,k{h^{ - 1}}$
Final velocity $\left( v \right) = 35\,km{h^{ - 1}}$
Time $ = 3hr$
\[a{\text{ }} = \dfrac{{\left( {{\text{ }}v - u} \right)}}{t}{\text{ }} = {\text{ }}\dfrac{{\left( {35 - 10} \right)}}{3} = {\text{ }}\dfrac{{25}}{3}\]
$\Rightarrow {v^2} = {u^2} + 2as$
Therefore, from this equation we will evaluate the value of $'s'$
$s = \dfrac{{\left( {{v^2} - {u^2}} \right)}}{{2a}} \\
\Rightarrow s = \dfrac{{\left\{ {{{\left( {35} \right)}^2} - {{\left( {10} \right)}^2}} \right\}}}{{2 \times 8.33}} \\
\therefore s = 67.5 $
When we add up all of the numbers, we get \[s = {\text{ }}67.5{\text{ }}km\], which is the same as the area of the trapezoid produced below AB. That indicates the moderators marked my answer incorrectly when I was correct. As a result, the total distance is \[67.5 + 175 = 242.5{\text{ }}km\] .The answer \[212.5{\text{ }}km\] is erroneous; the correct answer is \[242.5{\text{ }}km\].
Note:A constant speed is represented by a horizontal line on a speed-time graph. An acceleration is represented by a sloping line on a speed-time graph. The sloping line indicates that the object's speed is changing. The object is either accelerating or decelerating.
Recently Updated Pages
Master Class 11 Computer Science: Engaging Questions & Answers for Success
Master Class 11 Business Studies: Engaging Questions & Answers for Success
Master Class 11 Economics: Engaging Questions & Answers for Success
Master Class 11 English: Engaging Questions & Answers for Success
Master Class 11 Maths: Engaging Questions & Answers for Success
Master Class 11 Biology: Engaging Questions & Answers for Success
Trending doubts
One Metric ton is equal to kg A 10000 B 1000 C 100 class 11 physics CBSE
There are 720 permutations of the digits 1 2 3 4 5 class 11 maths CBSE
Discuss the various forms of bacteria class 11 biology CBSE
Draw a diagram of a plant cell and label at least eight class 11 biology CBSE
State the laws of reflection of light
Explain zero factorial class 11 maths CBSE