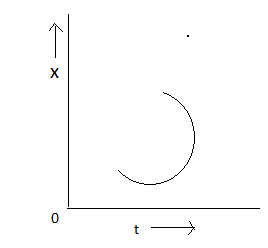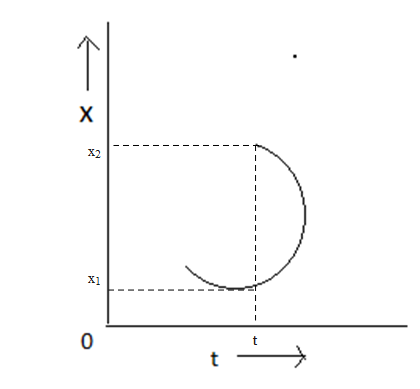
The graph of position- time shown in the figure for a particle is not possible because


Answer
571.8k+ views
Hint: Position- time graphs are generally used to describe the motion that the object is following. We take x-axis to denote time and y-axis to denote its position. The velocity is the slope of this position-time graph. As the steepness of the graph is increasing it has greater the value of its velocity. The velocity changes with the change in its slope always. That is, both the quantities are interrelated.
Complete step-by-step answer:

Since ${{x}_{1}}$ and ${{x}_{2}}$ are two positions at the same time it is not possible.
Position- time graphs are generally used to describe the motion that the object is following. We take x-axis to denote time and y-axis to denote its position. The velocity is the slope of this position-time graph. As the steepness of the graph is increasing it has greater the value of its velocity. The velocity changes with the change in its slope always. That is, both the quantities are interrelated. The position- time graph can be negative whenever the velocity is negative. If the position- time graph has a constant slope then it has a constant velocity.
Note: If the position- time graph has a constant slope then it has a constant velocity. As the steepness of the graph is increasing it has greater the value of its velocity. The velocity changes with the change in its slope always. The velocity is the slope of this position-time graph. Since ${{x}_{1}}$ and ${{x}_{2}}$ are two positions at the same time it is not possible in the case of a position-time graph.
Complete step-by-step answer:

Since ${{x}_{1}}$ and ${{x}_{2}}$ are two positions at the same time it is not possible.
Position- time graphs are generally used to describe the motion that the object is following. We take x-axis to denote time and y-axis to denote its position. The velocity is the slope of this position-time graph. As the steepness of the graph is increasing it has greater the value of its velocity. The velocity changes with the change in its slope always. That is, both the quantities are interrelated. The position- time graph can be negative whenever the velocity is negative. If the position- time graph has a constant slope then it has a constant velocity.
Note: If the position- time graph has a constant slope then it has a constant velocity. As the steepness of the graph is increasing it has greater the value of its velocity. The velocity changes with the change in its slope always. The velocity is the slope of this position-time graph. Since ${{x}_{1}}$ and ${{x}_{2}}$ are two positions at the same time it is not possible in the case of a position-time graph.
Recently Updated Pages
Master Class 11 Computer Science: Engaging Questions & Answers for Success

Master Class 11 Business Studies: Engaging Questions & Answers for Success

Master Class 11 Economics: Engaging Questions & Answers for Success

Master Class 11 English: Engaging Questions & Answers for Success

Master Class 11 Maths: Engaging Questions & Answers for Success

Master Class 11 Biology: Engaging Questions & Answers for Success

Trending doubts
One Metric ton is equal to kg A 10000 B 1000 C 100 class 11 physics CBSE

There are 720 permutations of the digits 1 2 3 4 5 class 11 maths CBSE

Discuss the various forms of bacteria class 11 biology CBSE

Draw a diagram of a plant cell and label at least eight class 11 biology CBSE

State the laws of reflection of light

Explain zero factorial class 11 maths CBSE


