


The horizontal and vertical lines in a line graph are usually called
Answer
514.2k+ views
Hint: First, we will see what the graph is.
A graph is a pictorial representation of the given data and that will help in easily analyzing the data.
The line graphs (graphs with lines only) are mostly used to represent the mutual variation of the given two quantities and that quantities will be either directly or inversely proportional to each other.
Complete step-by-step solution:
Horizon is the line along with the earth's surface, which is a straight line and that line maps from the left to the right and also parallel to the x-axis in the given plane coordinate system.

Which is the horizontal line.
Vertical lines that are one goes straight up and down, also parallel to the y-axis in the given coordinate systems. Vertical lines do not have to slope, where the slope is the ratio of changing the given vertical to horizon changes between the distinct two points.
Vertical lines can be represented as

Thus, horizontal lines in the line graph are called the x-axis. The vertical lines in the line graphs are called the y-axis.
Hence the two-dimensional graph with x and y axes can be represented as
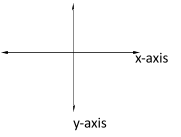
Where the right-hand side of the x-axis are positive numbers and the left-hand side are negative numbers.
In the y-axis, the top lines are positive numbers and the bottom are negative numbers.
Thus, the horizontal and vertical lines in a line graph are usually called the x-axis and y-axis respectively.
Note: In the line graph, there are three types.
> A single line graph consists of only one line that will represent the variation of the given two quantities.
> Double line graph, consists of two lines that will be representing the same data.
> Compound line graph, variation of the given any two quantities in the many different ways also it consists of more than three lines.
A graph is a pictorial representation of the given data and that will help in easily analyzing the data.
The line graphs (graphs with lines only) are mostly used to represent the mutual variation of the given two quantities and that quantities will be either directly or inversely proportional to each other.
Complete step-by-step solution:
Horizon is the line along with the earth's surface, which is a straight line and that line maps from the left to the right and also parallel to the x-axis in the given plane coordinate system.
Which is the horizontal line.
Vertical lines that are one goes straight up and down, also parallel to the y-axis in the given coordinate systems. Vertical lines do not have to slope, where the slope is the ratio of changing the given vertical to horizon changes between the distinct two points.
Vertical lines can be represented as
Thus, horizontal lines in the line graph are called the x-axis. The vertical lines in the line graphs are called the y-axis.
Hence the two-dimensional graph with x and y axes can be represented as
Where the right-hand side of the x-axis are positive numbers and the left-hand side are negative numbers.
In the y-axis, the top lines are positive numbers and the bottom are negative numbers.
Thus, the horizontal and vertical lines in a line graph are usually called the x-axis and y-axis respectively.
Note: In the line graph, there are three types.
> A single line graph consists of only one line that will represent the variation of the given two quantities.
> Double line graph, consists of two lines that will be representing the same data.
> Compound line graph, variation of the given any two quantities in the many different ways also it consists of more than three lines.
Recently Updated Pages
Master Class 10 Computer Science: Engaging Questions & Answers for Success
Master Class 10 General Knowledge: Engaging Questions & Answers for Success
Master Class 10 English: Engaging Questions & Answers for Success
Master Class 10 Social Science: Engaging Questions & Answers for Success
Master Class 10 Maths: Engaging Questions & Answers for Success
Master Class 10 Science: Engaging Questions & Answers for Success
Trending doubts
Which women's tennis player has 24 Grand Slam singles titles?
Who is the Brand Ambassador of Incredible India?
Why is there a time difference of about 5 hours between class 10 social science CBSE
The Equation xxx + 2 is Satisfied when x is Equal to Class 10 Maths
Which Country is Called "The Land of Festivals"?
What is Contraception List its four different methods class 10 biology CBSE