


The marks obtained by Sudhir in an examination are given below:
Subject English Hindi Mathematics Science Social science Marks obtained 105 75 150 120 90
Represent the above data by a pie chart.
| Subject | English | Hindi | Mathematics | Science | Social science |
| Marks obtained | 105 | 75 | 150 | 120 | 90 |
Answer
571.8k+ views
Hint: Here, we have been given marks for all subjects of Sudhir and we have to represent it as a pie chart. For this, we will first calculate the total marks of all the subjects. Then, using the total marks, we will calculate the fraction of marks for each subject. Once we obtain the fraction of marks of each subject, we will calculate the fraction out of the complete angle for each subject by multiplying the obtained fraction of marks by ${{360}^{\circ }}$ for each subject. Then we will draw a circle and inside that we will draw sectors with the obtained angles with the help of a scale, compass, and a protractor. Each sector will represent the data of its respective subject. Hence, we will get the required pie chart.
Complete step-by-step solution
Here, we have been given the following data:
Now, we have to represent this as a pie chart.
For this, we will calculate the fraction of marks of each subject, and then we will assign that fraction of the complete angle to that subject.
This is done as follows:
Now, the total marks are given to us as:
$105+75+150+120+90=540$
Now, we will calculate the fraction of marks for each subject.
Subject-1: English
The given marks in English are 105. Thus, the fraction of marks is:
$\begin{align}
& \dfrac{105}{540} \\
& \Rightarrow \dfrac{7}{36} \\
\end{align}$
Subject-2: Hindi
The given marks in hindi are 75. Thus, the fraction of marks is:
$\begin{align}
& \dfrac{75}{540} \\
& \Rightarrow \dfrac{5}{36} \\
\end{align}$
Subject-3: Mathematics
The given marks in mathematics are 150. Thus, the fraction of marks is:
$\begin{align}
& \dfrac{150}{540} \\
& \Rightarrow \dfrac{5}{18} \\
\end{align}$
Subject-4: Science
The given marks in science are 120. Thus, the fraction of marks is:
$\begin{align}
& \dfrac{120}{540} \\
& \Rightarrow \dfrac{2}{9} \\
\end{align}$
Subject-5: Social Science
The given marks in social science are 90. Thus, the fraction of marks is:
$\begin{align}
& \dfrac{90}{540} \\
& \Rightarrow \dfrac{1}{6} \\
\end{align}$
Now that we have the fraction of marks of all the subjects, we can find the fraction out of the complete angle for each subject too.
This is represented in the tabular form as follows:
Now that we have all the angles for the angles, we will draw sectors of these angles in a circle using compass, scale and a protractor and each angle will represent the data of its respective subject.
The required pie chart is given as follows:
Note: Always be careful while calculating the angles for each part as they are the most important part of drawing a pie chart. Also, remember that the sum of the fractions of angles of all the parts of the pie chart should be equal to ${{360}^{\circ }}$. Here, if we check the same, we will have:
$\begin{align}
& {{70}^{\circ }}+{{50}^{\circ }}+{{100}^{\circ }}+{{80}^{\circ }}+{{60}^{\circ }} \\
& \Rightarrow {{360}^{\circ }} \\
\end{align}$
Complete step-by-step solution
Here, we have been given the following data:
| Subject | English | Hindi | Mathematics | Science | Social science |
| Marks obtained | 105 | 75 | 150 | 120 | 90 |
Now, we have to represent this as a pie chart.
For this, we will calculate the fraction of marks of each subject, and then we will assign that fraction of the complete angle to that subject.
This is done as follows:
Now, the total marks are given to us as:
$105+75+150+120+90=540$
Now, we will calculate the fraction of marks for each subject.
Subject-1: English
The given marks in English are 105. Thus, the fraction of marks is:
$\begin{align}
& \dfrac{105}{540} \\
& \Rightarrow \dfrac{7}{36} \\
\end{align}$
Subject-2: Hindi
The given marks in hindi are 75. Thus, the fraction of marks is:
$\begin{align}
& \dfrac{75}{540} \\
& \Rightarrow \dfrac{5}{36} \\
\end{align}$
Subject-3: Mathematics
The given marks in mathematics are 150. Thus, the fraction of marks is:
$\begin{align}
& \dfrac{150}{540} \\
& \Rightarrow \dfrac{5}{18} \\
\end{align}$
Subject-4: Science
The given marks in science are 120. Thus, the fraction of marks is:
$\begin{align}
& \dfrac{120}{540} \\
& \Rightarrow \dfrac{2}{9} \\
\end{align}$
Subject-5: Social Science
The given marks in social science are 90. Thus, the fraction of marks is:
$\begin{align}
& \dfrac{90}{540} \\
& \Rightarrow \dfrac{1}{6} \\
\end{align}$
Now that we have the fraction of marks of all the subjects, we can find the fraction out of the complete angle for each subject too.
This is represented in the tabular form as follows:
| Subject | Fraction of marks | Fraction out of the complete angle $\left( {{360}^{\circ }} \right)$ |
| English | $\dfrac{7}{36}$ | $\dfrac{7}{36}\times {{360}^{\circ }}={{70}^{\circ }}$ |
| Hindi | $\dfrac{5}{36}$ | $\dfrac{5}{36}\times {{360}^{\circ }}={{50}^{\circ }}$ |
| Mathematics | $\dfrac{5}{18}$ | $\dfrac{5}{18}\times {{360}^{\circ }}={{100}^{\circ }}$ |
| Science | $\dfrac{2}{9}$ | $\dfrac{2}{9}\times {{360}^{\circ }}={{80}^{\circ }}$ |
| Social science | $\dfrac{1}{6}$ | $\dfrac{1}{6}\times {{360}^{\circ }}={{60}^{\circ }}$ |
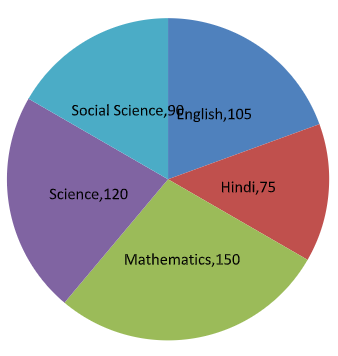
Now that we have all the angles for the angles, we will draw sectors of these angles in a circle using compass, scale and a protractor and each angle will represent the data of its respective subject.
The required pie chart is given as follows:
Note: Always be careful while calculating the angles for each part as they are the most important part of drawing a pie chart. Also, remember that the sum of the fractions of angles of all the parts of the pie chart should be equal to ${{360}^{\circ }}$. Here, if we check the same, we will have:
$\begin{align}
& {{70}^{\circ }}+{{50}^{\circ }}+{{100}^{\circ }}+{{80}^{\circ }}+{{60}^{\circ }} \\
& \Rightarrow {{360}^{\circ }} \\
\end{align}$
Recently Updated Pages
Master Class 10 Computer Science: Engaging Questions & Answers for Success
Master Class 10 General Knowledge: Engaging Questions & Answers for Success
Master Class 10 English: Engaging Questions & Answers for Success
Master Class 10 Social Science: Engaging Questions & Answers for Success
Master Class 10 Maths: Engaging Questions & Answers for Success
Master Class 10 Science: Engaging Questions & Answers for Success
Trending doubts
What is the median of the first 10 natural numbers class 10 maths CBSE
Which women's tennis player has 24 Grand Slam singles titles?
Who is the Brand Ambassador of Incredible India?
Why is there a time difference of about 5 hours between class 10 social science CBSE
Write a letter to the principal requesting him to grant class 10 english CBSE
A moving boat is observed from the top of a 150 m high class 10 maths CBSE