


The median of a given frequency distribution is found graphically with the help of
(A) Histogram
(B) Pie Chart
(C) Frequency Curve
(D) Ogive
Answer
579.3k+ views
Hint: We solve this question by first going through the definition of median and then we discuss the requirements to find the value of median. Then we consider the options given and see which of them has the requirements needed to find the median and find the correct graphical representation needed.
Complete step by step answer:
Here we need to find the median through graphical representation.
A median is the point which divides the given observations into two equal halves.
So, we need to find the graph that can give the exact mid-point of the given observations.
For finding the midpoint we need to find the sum of observations for every class, that is cumulative frequency for every class.
Among the given graphs in the options, the only graph that uses the cumulative frequency distribution is an Ogive.
An ogive is the graph of a cumulative frequency distribution. We create an ogive by plotting the points corresponding to the cumulative frequency of each interval.
There are two types of ogive. They are
1) Less than ogive
2) Greater than ogive
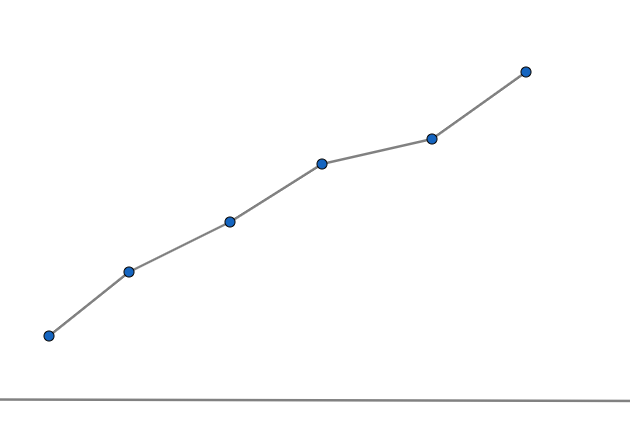
First let us consider the less than Ogive
It is drawn using the less than cumulative frequency, that is sum of frequencies of all preceding classes to every class.
It looks like,
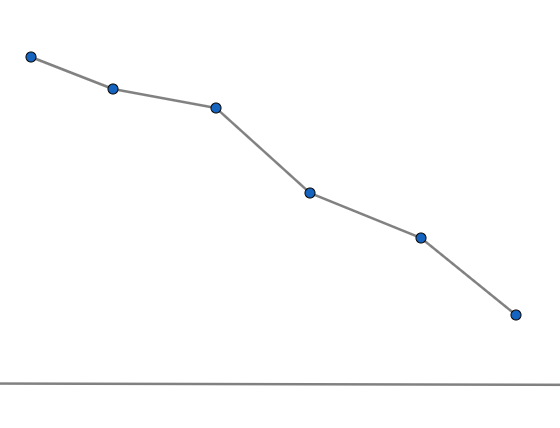
Now let us consider the greater than ogive
It is drawn using the greater than cumulative frequency, that is sum of frequencies of all succeeding classes to every class.
It looks like,
Now let us combine both the ogives in a single graph.
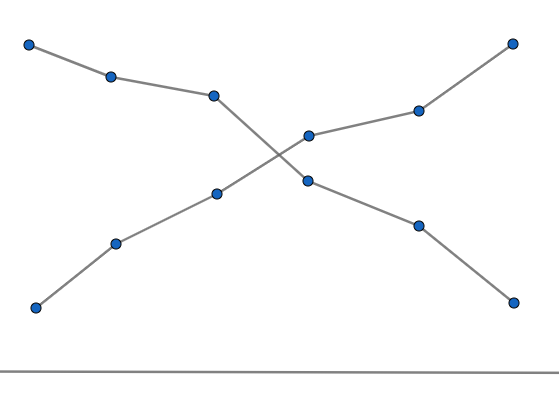
The above point of intersection of the both ogives gives us the median of the frequency distribution.
Note:
The common mistake one makes is one might answer the question as Histogram gives the median of the frequency distribution. But it is wrong because a histogram gives only the relation between the mean, median and mode by saying which is greater and which is lesser among them. But it cannot give the exact position of the median.
Complete step by step answer:
Here we need to find the median through graphical representation.
A median is the point which divides the given observations into two equal halves.
So, we need to find the graph that can give the exact mid-point of the given observations.
For finding the midpoint we need to find the sum of observations for every class, that is cumulative frequency for every class.
Among the given graphs in the options, the only graph that uses the cumulative frequency distribution is an Ogive.
An ogive is the graph of a cumulative frequency distribution. We create an ogive by plotting the points corresponding to the cumulative frequency of each interval.
There are two types of ogive. They are
1) Less than ogive
2) Greater than ogive
First let us consider the less than Ogive
It is drawn using the less than cumulative frequency, that is sum of frequencies of all preceding classes to every class.
It looks like,
Now let us consider the greater than ogive
It is drawn using the greater than cumulative frequency, that is sum of frequencies of all succeeding classes to every class.
It looks like,
Now let us combine both the ogives in a single graph.
The above point of intersection of the both ogives gives us the median of the frequency distribution.
Note:
The common mistake one makes is one might answer the question as Histogram gives the median of the frequency distribution. But it is wrong because a histogram gives only the relation between the mean, median and mode by saying which is greater and which is lesser among them. But it cannot give the exact position of the median.
Recently Updated Pages
Master Class 12 Economics: Engaging Questions & Answers for Success
Master Class 12 Physics: Engaging Questions & Answers for Success
Master Class 12 English: Engaging Questions & Answers for Success
Master Class 12 Social Science: Engaging Questions & Answers for Success
Master Class 12 Maths: Engaging Questions & Answers for Success
Master Class 12 Business Studies: Engaging Questions & Answers for Success
Trending doubts
Which are the Top 10 Largest Countries of the World?
What are the major means of transport Explain each class 12 social science CBSE
Draw a labelled sketch of the human eye class 12 physics CBSE
Why cannot DNA pass through cell membranes class 12 biology CBSE
Differentiate between insitu conservation and exsitu class 12 biology CBSE
Draw a neat and well labeled diagram of TS of ovary class 12 biology CBSE