


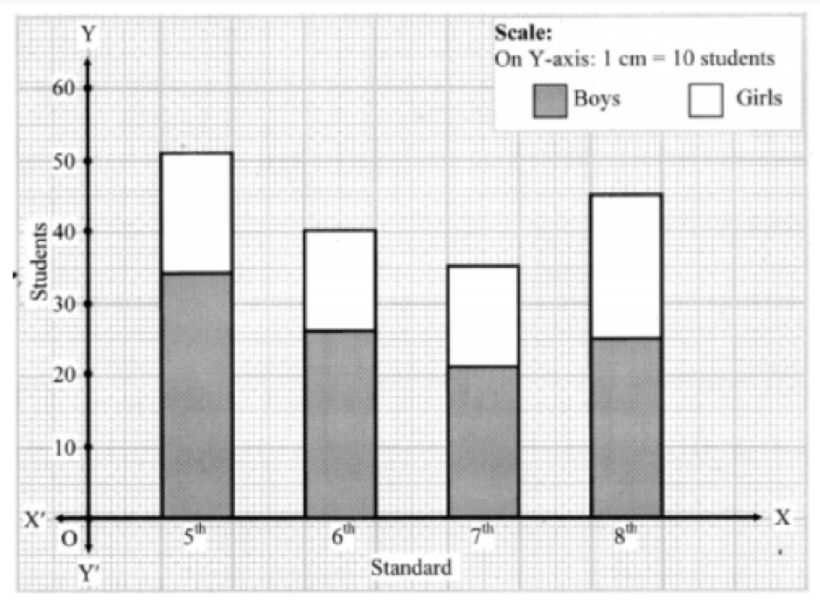
The number of boys and girls , in std. $5^{th}$ to std. $8^{th}$ in a Z.P. school is given in the table. Draw a subdivided bar graph to show the data.
(Scale: On Y axis , $1cm=10$ students
Standard 5 6 7 8 Boys 34 26 21 25 Girls 17 14 14 20
| Standard | 5 | 6 | 7 | 8 |
| Boys | 34 | 26 | 21 | 25 |
| Girls | 17 | 14 | 14 | 20 |
Answer
565.8k+ views
Hint: For this question, first we have to observe how many boys and girls are there in the table and then represent the given data on the bar graph with the help of scale.
Complete step-by-step answer:
It is given in the table there are some students of classes 5th, 6th,7th and 8th and students were divided into girls and boys.
Now to represent it in a bar graph, we should take care of scale like, how many students in $1cm$ and where we are going to represent boys and where girls.
It is mentioned in the question, on y-axis $1cm=10$ students then we have to follow it
In the graph, on the x-axis there are four bars and each one represents one individual class or standard.
On the y-axis it represents the number of students 1 square or $1cm$ represents $10\,students$.
Dark colour represents the number of boys and light colour represents the number of girls.
Additional information: x-axis-The line on a graph that runs horizontally through zero or origin.
y-axis- The line on a graph that runs vertically through zero.
Scale- A scale on the graph shows the way numbers or pictures are used in data.
Note: Such types of problems can be represented in other forms like pie-chart. Sometimes students are unable to distinguish between x-axis and y-axis, they should have to take care of all these.
Recently Updated Pages
Master Class 10 Computer Science: Engaging Questions & Answers for Success
Master Class 10 General Knowledge: Engaging Questions & Answers for Success
Master Class 10 English: Engaging Questions & Answers for Success
Master Class 10 Social Science: Engaging Questions & Answers for Success
Master Class 10 Maths: Engaging Questions & Answers for Success
Master Class 10 Science: Engaging Questions & Answers for Success
Trending doubts
What is the median of the first 10 natural numbers class 10 maths CBSE
Which women's tennis player has 24 Grand Slam singles titles?
Who is the Brand Ambassador of Incredible India?
Why is there a time difference of about 5 hours between class 10 social science CBSE
Write a letter to the principal requesting him to grant class 10 english CBSE
A moving boat is observed from the top of a 150 m high class 10 maths CBSE