


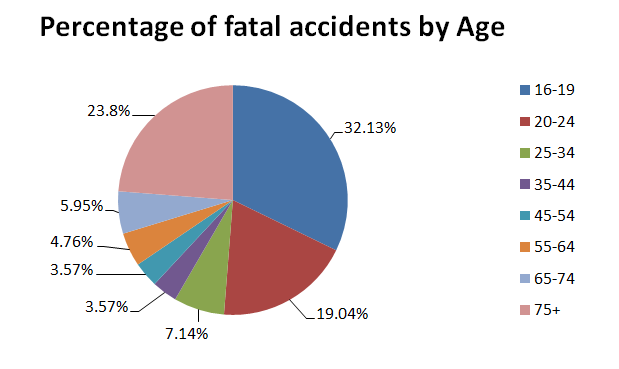
The pie chart shows the percentage of individuals in different age groups that have met fatal road accidents. What do you think according to the given data is the safest age group to drive?
\[(A) 35 - 54\]
\[(B) 16 - 19\]
$(C) 65 - 74$
$(D) 25 - 34$
Answer
571.5k+ views
Hint: Here, we have to find out the person who was to drive in the safest age group.
So we have to check the option one by one. Then we get the percentage of each option.
Finally we conclude the required answer.
Complete step-by-step solution:
Looking through the pie chart and relating the given information with respective of different colours, we get the following information:
According to Option ${\text{(A)}}$,
The percentage of fatal accidents met by the age group $35 - 54$ = $3.57\% + 3.57\% $ = $7.14\%$
According to Option ${\text{(B)}}$,
The percentage of fatal accidents met by the age group $16 - 19$=$32.13\% $
According to Option ${\text{(C)}}$,
The percentage of fatal accidents met by the age group $65 - 74$= $5.95\% $
According to Option ${\text{(D)}}$,
The percentage of fatal accidents met by the age group $25 - 34$= $7.14\% $
So among the given options the age group of $65-74$ has the least number of accidents.
Age groups of $35-44$ and $45-54$ have the least percent individually. But when we compare both those groups as a single unit the accident percentage is more.
Therefore, the correct answer is ${\text{(C)}}$
Note: In these types of questions, don’t panic by seeing the size of the questions. We can find the solution by just looking through the question completely.
Compare the given options with the other options. Here, the question is to find the safest age group to drive. So, we should look for the least percentage of accidents that meet the age group.
Here, if the question is given as “Which is the most dangerous age group to drive?” then the answer would be the age group of $16 - 19$ which holds the maximum percentages of fatal accidents. (i.e.) $32.13\% $
Recently Updated Pages
Master Class 11 Computer Science: Engaging Questions & Answers for Success
Master Class 11 Business Studies: Engaging Questions & Answers for Success
Master Class 11 Economics: Engaging Questions & Answers for Success
Master Class 11 English: Engaging Questions & Answers for Success
Master Class 11 Maths: Engaging Questions & Answers for Success
Master Class 11 Biology: Engaging Questions & Answers for Success
Trending doubts
One Metric ton is equal to kg A 10000 B 1000 C 100 class 11 physics CBSE
There are 720 permutations of the digits 1 2 3 4 5 class 11 maths CBSE
Discuss the various forms of bacteria class 11 biology CBSE
Draw a diagram of a plant cell and label at least eight class 11 biology CBSE
State the laws of reflection of light
Explain zero factorial class 11 maths CBSE