


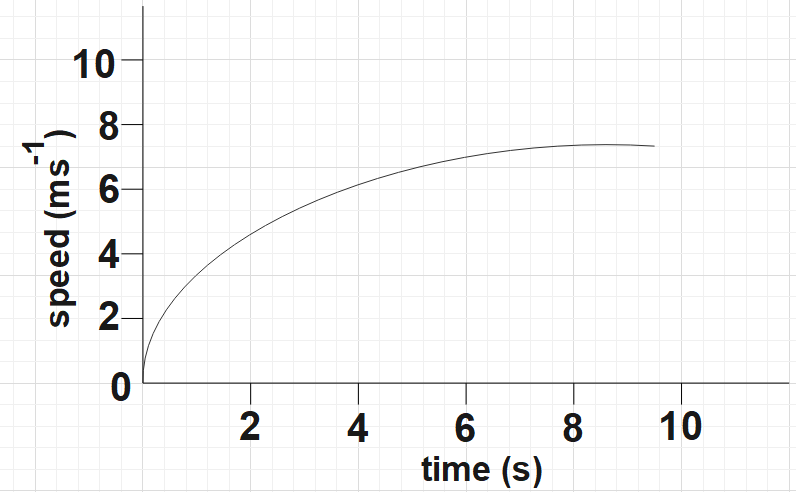
The speed-time graph for a car is shown in below figure
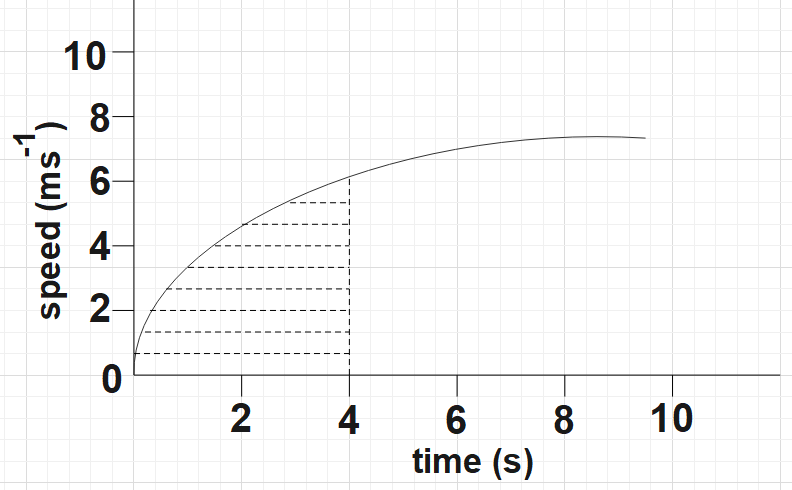
(a) Find out how far the car travels in the first 4 seconds. Shade the area on the graph that represents the distance travelled by the car during the period.
(b) Which part of the graph represents uniform motion of the car?
Answer
504.9k+ views
Hint: We are asked to find the displacement for a given duration with just a graph for the motion given. All we have to know is that the area under the speed time graph gives the distance covered. For the second part, find where the graph becomes parallel to the time axis as this would imply constant speed which further implies uniform motion.
Complete step-by-step solution:
In the question, we are given the speed-time graph of a car.
(a) Here, we are asked to determine how far this car travels in the first 4 seconds. We are also asked to shade the area on the graph that represents the distance travelled by the car over this period.
One could observe the graph more closely to find the total number of divisions on the horizontal axis for the 2s is found to be 5 and that on the vertical axis is found to be 3.
Now, you may recall that the total displacement could be found from the area under the speed time graph. So, the area under the $\left( 3\times 5 \right)$squares would be,
${{A}_{15}}=2\times 2=4$
Now this is the area for 15 small squares, so the area of one such square would be,
${{A}_{1}}=\dfrac{4}{5}$
We could now find the number of squares under the graph for 4sec,
N= 57 small squares + 6 half small squares= 60small squares
Now we could find the area under the graph, and this would be the required displacement.
$S=60\times \dfrac{4}{15}=16m$
We found the displacement to be 16m.
The below shaded portion represents the distance travelled during this period.
(b) From the graph, we could clearly see that after the instant of t=6s, the speed does become constant. So, this is the portion where the motion becomes constant.
Note:A very important point to be kept in mind here is that the area under the speed-time graph gives the displacement of the given motion. Distance by definition is the path covered by an object in a given period of time. You find the displacement for any time by following the above procedure of counting the small squares and multiplying it with the area of one such small square.
Recently Updated Pages
Master Class 11 Computer Science: Engaging Questions & Answers for Success
Master Class 11 Business Studies: Engaging Questions & Answers for Success
Master Class 11 Economics: Engaging Questions & Answers for Success
Master Class 11 English: Engaging Questions & Answers for Success
Master Class 11 Maths: Engaging Questions & Answers for Success
Master Class 11 Biology: Engaging Questions & Answers for Success
Trending doubts
One Metric ton is equal to kg A 10000 B 1000 C 100 class 11 physics CBSE
There are 720 permutations of the digits 1 2 3 4 5 class 11 maths CBSE
Discuss the various forms of bacteria class 11 biology CBSE
Draw a diagram of a plant cell and label at least eight class 11 biology CBSE
State the laws of reflection of light
Explain zero factorial class 11 maths CBSE