


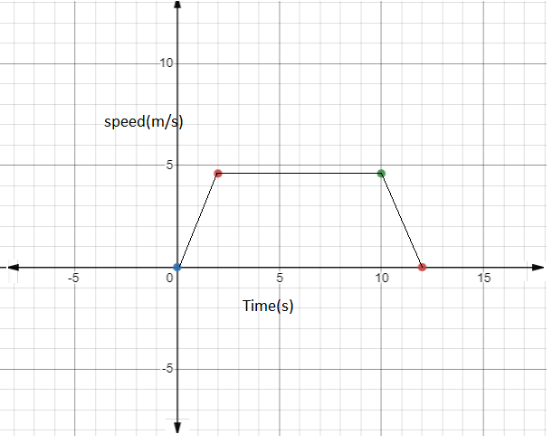
The speed-time graph of an ascending passenger lift is given alongside . What is the acceleration of the lift (a) during the first two seconds ? (b) between second and tenth second ? (c) during the last two seconds ?
Answer
504k+ views
Hint: We know that the speed at a certain time is the magnitude of the velocity at that time. So we can follow equations of motion to draw speed time graphs. In mechanics, acceleration is the rate of change of the velocity of an object with respect to time. Accelerations are vector quantities (in that they have magnitude and direction).
Complete step by step answer:
The orientation of an object's acceleration is given by the orientation of the net force acting on that object. The magnitude of an object's acceleration, as described by Newton's Second Law,[3] is the combined effect of two causes: the net balance of all external forces acting on that object — magnitude is directly proportional to this net resulting force;that object's mass, depending on the materials out of which it is made — magnitude is inversely proportional to the object's mass.The SI unit for acceleration is metre per second squared Speed-time graphs with constant speed (zero acceleration)
When the speed is constant, the speed time graph, with Y-axis denoting speed and X-axis denoting time, As clear from the graph, the speed is constant (c) throughout the time interval. No matter how much the time changes, the speed will be c at every instant.
Example: If the acceleration of a particle is zero (0), and speed is constant say 5 m/s at t =0, then it will remain constant throughout the time. When the acceleration is constant, and the initial speed of the particle is zero, the speed of the particle will increase linearly, as predicted by the equation: \[v = u + at\] Since \[u = 0\] \[v = at\] the speed of the particle will increase linearly with respect to time. The slope of the graph will give the magnitude of acceleration.
Example: If the acceleration of a particle is constant (k) and initial speed is zero, the speed increases or decreases linearly. The slope of the speed-time graph will give the magnitude of acceleration (k).When the acceleration is increasing with time, the speed time graph will be a curve, as predicted from the equation: \[v = u + at\] Since \[u = 0\] \[v = at\] Since acceleration is a function of time, speed time graph will be a curve.
If the acceleration of a particle is a function of time and initial speed is zero, the speed-time graph will be a curve. The slope of the speed-time graph at any instant (at a certain time) will give the magnitude of acceleration at that time.It was just the case of increasing acceleration. There will be a different graph when the acceleration is decreasing with time.
(a) We have to find the acceleration from the given graph. Acceleration = slope of line AB = 2.3. (b) Between second and tenth second, it represents uniform speed, so, acceleration acting on the lift is zero. (c) During the last two seconds, it represents retardation of the lift, so its acceleration is \[-2.3\dfrac{m}{{{s^2}}}\]
Note: Since the acceleration is continuously increasing with time, the magnitude of the slope will also continuously increase with time. We know that the speed at a certain time is the magnitude of the velocity at that time. So we can follow equations of motion to draw speed time graphs.
Recently Updated Pages
Master Class 11 Computer Science: Engaging Questions & Answers for Success
Master Class 11 Business Studies: Engaging Questions & Answers for Success
Master Class 11 Economics: Engaging Questions & Answers for Success
Master Class 11 English: Engaging Questions & Answers for Success
Master Class 11 Maths: Engaging Questions & Answers for Success
Master Class 11 Biology: Engaging Questions & Answers for Success
Trending doubts
One Metric ton is equal to kg A 10000 B 1000 C 100 class 11 physics CBSE
There are 720 permutations of the digits 1 2 3 4 5 class 11 maths CBSE
Discuss the various forms of bacteria class 11 biology CBSE
Draw a diagram of a plant cell and label at least eight class 11 biology CBSE
State the laws of reflection of light
Explain zero factorial class 11 maths CBSE