
The velocity-time graph of a body falling from rest under gravity and rebounding from a solid surface is represented by which of the graphs shown in the figure?
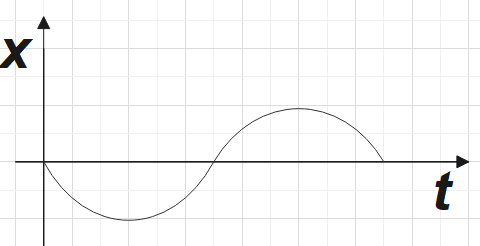
A.
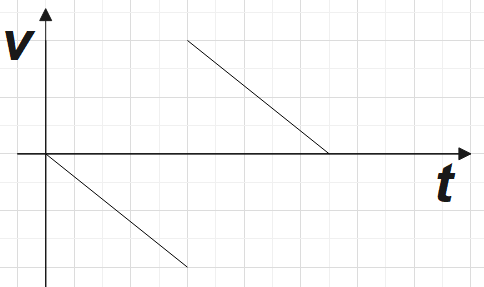
B.
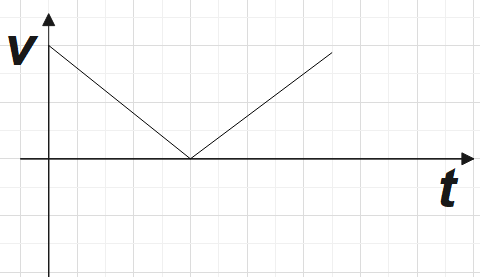
C.
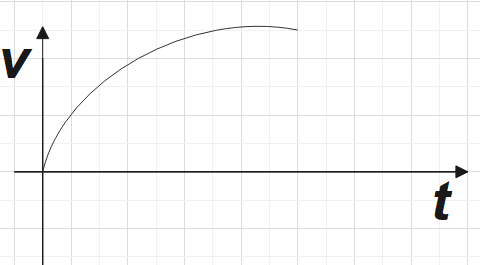
D.


Answer
516k+ views
Hint: One could read the question and hence understand the situation well. One could imagine the case of a body that is under free fall and gets rebounded. This body would have gravitational force as the only force that acts on it. Keeping all these points in mind answers the question.
Complete step by step answer:
In the question, we are given a set of graphs in the options. We are supposed to find which among them represents the velocity time graph in which the body is undergoing fall under gravity and being rebounded from a solid surface.
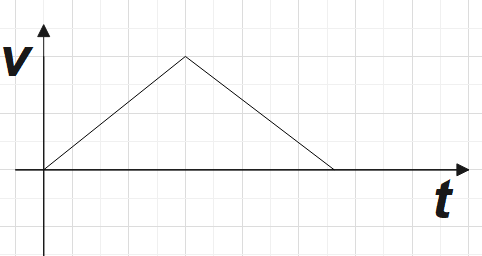
We are told that the body starts falling from rest which would directly imply that the initial velocity at this point would be equal to zero. Now for a body undergoing free fall, the only force on it would be that due to gravity and the body would accelerate with constant acceleration g until the body reaches the maximum velocity at the solid surface and then get rebounds.
Now rebounding the body undergoes constant deceleration g until the final speed of the body is zero.
From the above explanation, we see that the graph would look something like this;
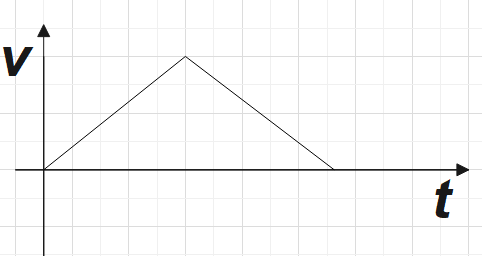
So, the correct answer is “Option D”.
Note: When the body has zero acceleration in other words for motion of the body with uniform velocity, the velocity time graph would be parallel to the time axis. And for the positive acceleration, it would be a straight line graph with positive slope and it would be a straight line graph with negative slope for motion of the body undergoing constant deceleration.
Complete step by step answer:
In the question, we are given a set of graphs in the options. We are supposed to find which among them represents the velocity time graph in which the body is undergoing fall under gravity and being rebounded from a solid surface.
We are told that the body starts falling from rest which would directly imply that the initial velocity at this point would be equal to zero. Now for a body undergoing free fall, the only force on it would be that due to gravity and the body would accelerate with constant acceleration g until the body reaches the maximum velocity at the solid surface and then get rebounds.
Now rebounding the body undergoes constant deceleration g until the final speed of the body is zero.
From the above explanation, we see that the graph would look something like this;

So, the correct answer is “Option D”.
Note: When the body has zero acceleration in other words for motion of the body with uniform velocity, the velocity time graph would be parallel to the time axis. And for the positive acceleration, it would be a straight line graph with positive slope and it would be a straight line graph with negative slope for motion of the body undergoing constant deceleration.
Recently Updated Pages
Master Class 11 Computer Science: Engaging Questions & Answers for Success

Master Class 11 Business Studies: Engaging Questions & Answers for Success

Master Class 11 Economics: Engaging Questions & Answers for Success

Master Class 11 English: Engaging Questions & Answers for Success

Master Class 11 Maths: Engaging Questions & Answers for Success

Master Class 11 Biology: Engaging Questions & Answers for Success

Trending doubts
One Metric ton is equal to kg A 10000 B 1000 C 100 class 11 physics CBSE

There are 720 permutations of the digits 1 2 3 4 5 class 11 maths CBSE

Discuss the various forms of bacteria class 11 biology CBSE

Draw a diagram of a plant cell and label at least eight class 11 biology CBSE

State the laws of reflection of light

Explain zero factorial class 11 maths CBSE


