


How do you use transformation to graph the cosine function and determine the amplitude and period of \[y = - \cos \left( {x - \dfrac{\pi }{4}} \right)\] ?
Answer
537.3k+ views
Hint: Here in this question, we have to find the period, amplitude and graph of given sine function. Use the form \[a\cos \left( {bx - c} \right) + d\] to Find the amplitude = \[\left| a \right|\] , then Find the period using the formula \[\dfrac{{2\pi }}{{\left| b \right|}}\] and draw a sketch or graph for the co-ordinates \[\left( {x,y} \right)\] by the giving the \[x\] value as 0, 1, 2, 3… we can easily find the value of y by using the given expression.
Complete step-by-step answer:
Let's use the form of the equation i.e., \[a\cos \left( {bx - c} \right) + d\] to find the variables used to find the amplitude, and period.
Now consider the given expression \[y = - \cos \left( {x - \dfrac{\pi }{4}} \right)\]
Where,
\[a = - 1\]
\[b = 1\]
\[c = \dfrac{\pi }{4}\]
\[d = 0\]
The Amplitude is the height from the centre line to the peak (or to the trough). Or we can measure the height from highest to lowest points and divide that by 2.
To Find the amplitude = \[\left| a \right|\] .
\[ \Rightarrow \,\,\] Amplitude \[ = \left| a \right| = \left| { - 1} \right| = 1\]
Period is the complete revolution of a wave completing crest and followed by trough.
Otherwise
The Period goes from one peak to the next (or from any point to the next matching point):
Find the period using the formula \[\dfrac{{2\pi }}{{\left| b \right|}}\]
\[ \Rightarrow \,\,\] Period \[ = \dfrac{{2\pi }}{{\left| b \right|}} = \dfrac{{2\pi }}{{\left| 1 \right|}}\, = 2\pi \]
Sketch or graph we can draw by using the coordinates
For coordinates, giving the x values 0, 1, 2, 3… simultaneously to the given equation to get the values of y
The sketch of the given function \[y = - \cos \left( {x - \dfrac{\pi }{4}} \right)\] is:
Note: The period is the length of the smallest interval that contains exactly one copy of the repeating pattern. The Amplitude is the height from the centre line to the peak. We use the form of equation i.e., \[a\sin \left( {bx - c} \right) + d\] and we have formula for the period and amplitude and hence we determine the values.
Complete step-by-step answer:
Let's use the form of the equation i.e., \[a\cos \left( {bx - c} \right) + d\] to find the variables used to find the amplitude, and period.
Now consider the given expression \[y = - \cos \left( {x - \dfrac{\pi }{4}} \right)\]
Where,
\[a = - 1\]
\[b = 1\]
\[c = \dfrac{\pi }{4}\]
\[d = 0\]
The Amplitude is the height from the centre line to the peak (or to the trough). Or we can measure the height from highest to lowest points and divide that by 2.
To Find the amplitude = \[\left| a \right|\] .
\[ \Rightarrow \,\,\] Amplitude \[ = \left| a \right| = \left| { - 1} \right| = 1\]
Period is the complete revolution of a wave completing crest and followed by trough.
Otherwise
The Period goes from one peak to the next (or from any point to the next matching point):
Find the period using the formula \[\dfrac{{2\pi }}{{\left| b \right|}}\]
\[ \Rightarrow \,\,\] Period \[ = \dfrac{{2\pi }}{{\left| b \right|}} = \dfrac{{2\pi }}{{\left| 1 \right|}}\, = 2\pi \]
Sketch or graph we can draw by using the coordinates
For coordinates, giving the x values 0, 1, 2, 3… simultaneously to the given equation to get the values of y
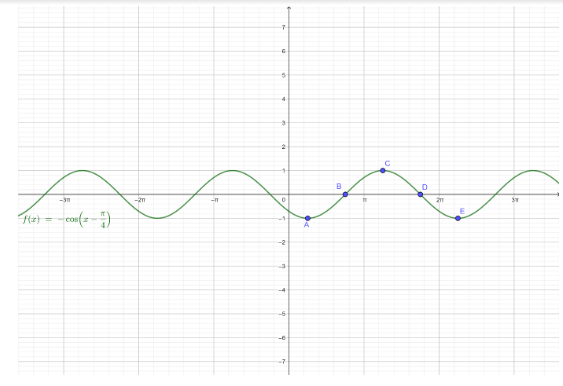
| \[x\] | \[\dfrac{\pi }{4}\] | \[\dfrac{{3\pi }}{4}\] | \[\dfrac{{5\pi }}{4}\] | \[\dfrac{{7\pi }}{4}\] | \[\dfrac{{9\pi }}{4}\] |
| \[y = - \cos \left( {x - \dfrac{\pi }{4}} \right)\] | \[ - 1\] | \[0\] | \[1\] | \[0\] | \[ - 1\] |
| \[\left( {x,y} \right)\] | \[\left( {\dfrac{\pi }{4}, - 1} \right)\] | \[\left( {\dfrac{{3\pi }}{4},0} \right)\] | \[\left( {\dfrac{{5\pi }}{4},1} \right)\] | \[\left( {\dfrac{{7\pi }}{4},0} \right)\] | \[\left( {\dfrac{{9\pi }}{4}, - 1} \right)\] |
The sketch of the given function \[y = - \cos \left( {x - \dfrac{\pi }{4}} \right)\] is:
Note: The period is the length of the smallest interval that contains exactly one copy of the repeating pattern. The Amplitude is the height from the centre line to the peak. We use the form of equation i.e., \[a\sin \left( {bx - c} \right) + d\] and we have formula for the period and amplitude and hence we determine the values.
Recently Updated Pages
Master Class 11 Computer Science: Engaging Questions & Answers for Success
Master Class 11 Business Studies: Engaging Questions & Answers for Success
Master Class 11 Economics: Engaging Questions & Answers for Success
Master Class 11 English: Engaging Questions & Answers for Success
Master Class 11 Maths: Engaging Questions & Answers for Success
Master Class 11 Biology: Engaging Questions & Answers for Success
Trending doubts
One Metric ton is equal to kg A 10000 B 1000 C 100 class 11 physics CBSE
There are 720 permutations of the digits 1 2 3 4 5 class 11 maths CBSE
Discuss the various forms of bacteria class 11 biology CBSE
Draw a diagram of a plant cell and label at least eight class 11 biology CBSE
State the laws of reflection of light
Explain zero factorial class 11 maths CBSE