


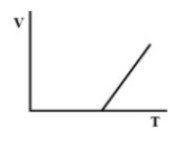
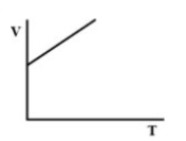
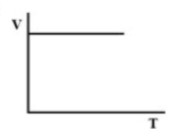
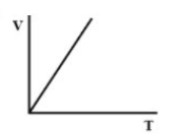
Volume-Temperature graph at atmospheric pressure for a monoatomic gas ( V in m$^3$, T in $^\circ$C) is_______
(A).
(B).
(C).
(D).
Answer
586.5k+ views
Hint: We all know that a gas follows the ideal gas equation at low pressure and high temperature. One of the parameters can be varied concerning the other parameters by keeping all extra parameters as constant. We can then analyze the variation of pressure, temperature, and volume to each other.
Complete step by step solution:
We know about the ideal gas equation that,
$PV = nRT$
Here, P is the absolute pressure of the gas, V is the volume occupied by the gas, R is the universal gas constant, and T is the absolute temperature, n is the number of moles of a gas.
For deriving this equation, the gas is assumed to be at low pressure and high temperature. Suppose if the pressure of the gas is held constant, then the relationship becomes linear between volume and temperature as R and n along with P is steady now. We get the relation as,
$V = \dfrac{{nR}}{P}T$
Since $\dfrac{{nR}}{P} = C$ it is constant, so the above relation becomes,
$V = CT$
Here we can express the relation as,
$V \propto T$
Here, V is having a linear relation with T. So, there is a straight-line relation between V and T.
Therefore, there must be a straight-line relation between V and T, and the correct option is (D).
Note: Also, we can analyze that when the volume is held constant, the pressure can be varied to temperature and follows a linear relation with temperature. Here the pressure that we are using is absolute and not gauge pressure.
Recently Updated Pages
Master Class 11 Computer Science: Engaging Questions & Answers for Success
Master Class 11 Business Studies: Engaging Questions & Answers for Success
Master Class 11 Economics: Engaging Questions & Answers for Success
Master Class 11 English: Engaging Questions & Answers for Success
Master Class 11 Maths: Engaging Questions & Answers for Success
Master Class 11 Biology: Engaging Questions & Answers for Success
Trending doubts
One Metric ton is equal to kg A 10000 B 1000 C 100 class 11 physics CBSE
There are 720 permutations of the digits 1 2 3 4 5 class 11 maths CBSE
Discuss the various forms of bacteria class 11 biology CBSE
Draw a diagram of a plant cell and label at least eight class 11 biology CBSE
State the laws of reflection of light
Explain zero factorial class 11 maths CBSE