


What is a unimodal distribution?
Answer
527.1k+ views
Hint: Here first we will understand the term ‘mode’ used in statistics. Further we will see the cases of a distribution having one or more modes and special names given to these types of distribution. We will understand the terms like bimodal distributions and multimodal distributions.
Complete step by step solution:
Here we have been asked to describe the term unimodal distribution. First let us understand the term ‘mode’ of a given set of data in statistics.
In mathematics, mode of a given data set or distribution is defined as the data which is appearing the most number of times or most frequently. For example: - let us consider a simple data set containing 6 elements given as 1, 4, 3, 4, 5, 4, 7. Here, we can see that the number 4 in appearing three times while other numbers are appearing one time each, so we can say that 4 is appearing most frequently therefore the mode of the data is 4.
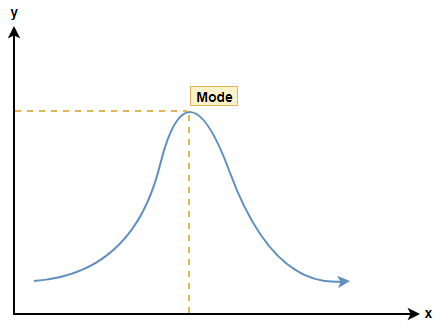
Now, if we understand this using the graph of a distribution then we will say that the mode will be the highest peak value in the graph.
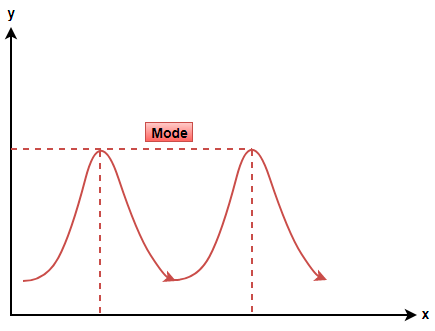
It may be possible that the graph has more than 1 similar peak. If that is the case then the following are the possibilities that may arise: -
(i) If there are two peaks at equal levels then the distribution is called bimodal distribution.
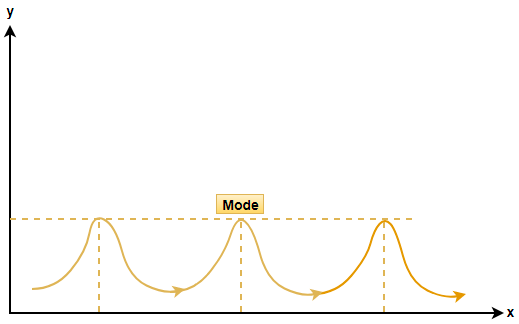
(ii) If there are more than two peaks at equal levels then the distribution is called multimodal distribution.
Note: Note that there are many terms in statistics and these distributions are further classified into symmetrical and asymmetrical distributions. In case of symmetrical distributions the mean, median and mode of the data coincides while in moderately asymmetrical distributions if we know the value of mean and median then we use the empirical relation given as Mode = 3(Median) – 2(Mean) to determine the mode value.
Complete step by step solution:
Here we have been asked to describe the term unimodal distribution. First let us understand the term ‘mode’ of a given set of data in statistics.
In mathematics, mode of a given data set or distribution is defined as the data which is appearing the most number of times or most frequently. For example: - let us consider a simple data set containing 6 elements given as 1, 4, 3, 4, 5, 4, 7. Here, we can see that the number 4 in appearing three times while other numbers are appearing one time each, so we can say that 4 is appearing most frequently therefore the mode of the data is 4.
Now, if we understand this using the graph of a distribution then we will say that the mode will be the highest peak value in the graph.
It may be possible that the graph has more than 1 similar peak. If that is the case then the following are the possibilities that may arise: -
(i) If there are two peaks at equal levels then the distribution is called bimodal distribution.
(ii) If there are more than two peaks at equal levels then the distribution is called multimodal distribution.
Note: Note that there are many terms in statistics and these distributions are further classified into symmetrical and asymmetrical distributions. In case of symmetrical distributions the mean, median and mode of the data coincides while in moderately asymmetrical distributions if we know the value of mean and median then we use the empirical relation given as Mode = 3(Median) – 2(Mean) to determine the mode value.
Recently Updated Pages
Master Class 11 Computer Science: Engaging Questions & Answers for Success
Master Class 11 Business Studies: Engaging Questions & Answers for Success
Master Class 11 Economics: Engaging Questions & Answers for Success
Master Class 11 English: Engaging Questions & Answers for Success
Master Class 11 Maths: Engaging Questions & Answers for Success
Master Class 11 Biology: Engaging Questions & Answers for Success
Trending doubts
One Metric ton is equal to kg A 10000 B 1000 C 100 class 11 physics CBSE
There are 720 permutations of the digits 1 2 3 4 5 class 11 maths CBSE
Discuss the various forms of bacteria class 11 biology CBSE
Draw a diagram of a plant cell and label at least eight class 11 biology CBSE
State the laws of reflection of light
Explain zero factorial class 11 maths CBSE