Which of the following graphs indicates that a body is undergoing retardation?
The X axis represents the time axis in all the options below.
A.

B.

C.

D.


Answer
562.8k+ views
Hint: The graphs are typically easy to solve at most of the times but sometimes they become quite difficult. We need to find which of the above-mentioned graphs shows that the body is undergoing retardation. Retardation is nothing but acceleration which decreases with time that is negative acceleration.
Complete step by step answer:
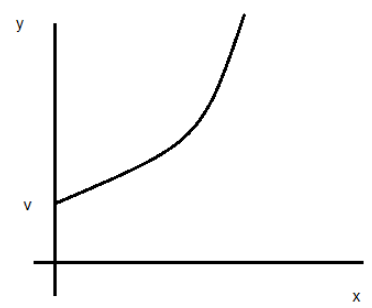
Option A: Shows the velocity time graph, we know that the slope of the velocity time graph gives acceleration. At time t=0, the body has some velocity and as the time increases the velocity increases, so the slope is positive and body has positive acceleration. So, option A is incorrect.
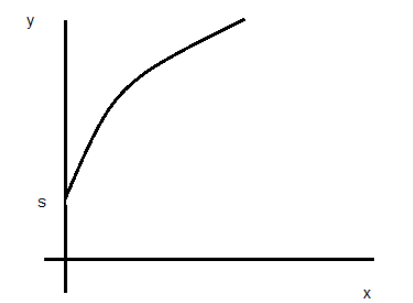
Option B: It is a displacement time curve and we know that the slope of displacement time curve gives velocity. it is downward parabola and so negative slope and thus, option B is correct.
Option C: Represents positive slope, upward parabola and thus it can’t be retardation.
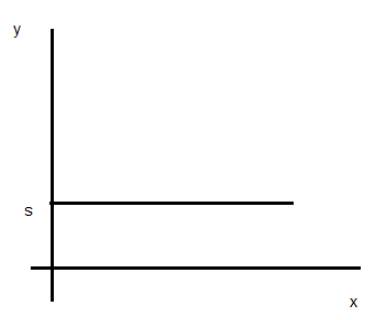
Option D: It is a displacement time curve and it is a straight line parallel to the time axis, which means, the body is at rest as its displacement does not change with time. So, zero velocity and zero acceleration.
Hence, option B is the correct answer.
Additional information:
Retardation is nothing but a negative acceleration. The velocity of the body may either increase or decrease. The change in velocity is known as acceleration. If the velocity of the body increases, acceleration is said to be positive. Similarly, if the velocity decreases, the acceleration is said to be negative.The train reaching the station slows down, in this case, we can say that the train is retarding. Retardation is acceleration with a negative sign. Or the negative value of acceleration shows that the velocity of a body is decreasing.
Note:The slope of the acceleration time graph is known as jerk. Following are the points understood from the graph:
-If slope is zero, then the motion is said to have constant acceleration.
-The area under the graph represents the change in velocity.
Recently Updated Pages
Master Class 11 Computer Science: Engaging Questions & Answers for Success

Master Class 11 Business Studies: Engaging Questions & Answers for Success

Master Class 11 Economics: Engaging Questions & Answers for Success

Master Class 11 English: Engaging Questions & Answers for Success

Master Class 11 Maths: Engaging Questions & Answers for Success

Master Class 11 Biology: Engaging Questions & Answers for Success

Trending doubts
There are 720 permutations of the digits 1 2 3 4 5 class 11 maths CBSE

Discuss the various forms of bacteria class 11 biology CBSE

Explain zero factorial class 11 maths CBSE

What organs are located on the left side of your body class 11 biology CBSE

Draw a diagram of nephron and explain its structur class 11 biology CBSE

How do I convert ms to kmh Give an example class 11 physics CBSE


