


Which of the following is a two – dimensional diagram?
(a) Pie – Chart
(b) Multiple bars
(c) Bar
(d) None of them
Answer
520.6k+ views
Hint: To solve this question, we will first of all define what a one – dimensional diagram is and then elaborate it with an example and a diagram. In relation to it, we will then define a two-dimensional diagram and give an example to it, so as to get clear with the options.
Complete step by step answer:
Let us first define what a two – dimensional diagram is. Before that let us first see what one – dimensional diagram is. A diagram in which the size of only one dimension, i.e. the length is fixed in proportion to the value of the data is called a dimensional diagram. Such diagrams are also popularly called bar diagrams. An example is given below:
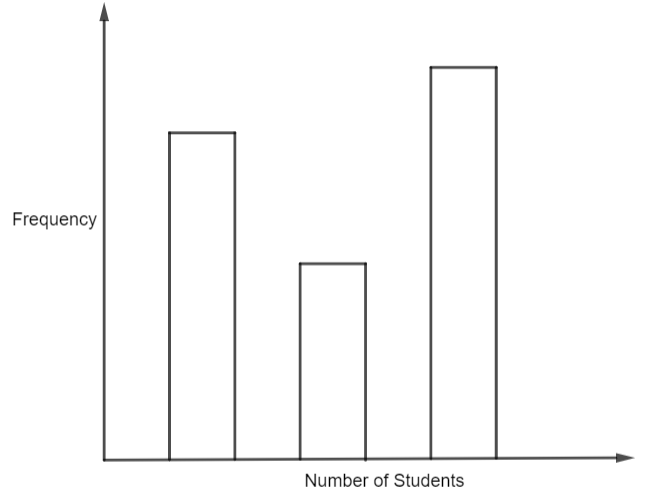
Now, let us define a two-dimensional diagram. In two dimensional diagrams, the areas of the diagrams are used to represent the magnitudes. Rectangles, squares and circles with area proportional to the observations are used to represent each category of these, circles are most commonly used. Such diagrams are called pie – diagrams. An example of a pie – chart is:
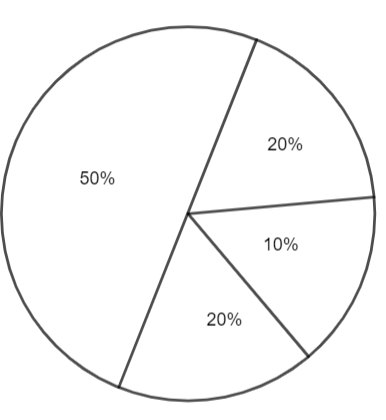
So, we observe from the options that the first option (a) Pie chart is our required answer.
Hence, the two-dimensional diagram is the Pie chart.
So, the correct answer is “Option A”.
Note: Observe the options, as we have already seen that the example of one – dimensional diagram is a bar graph, so the options having “multiple bars” and “bar” is not possible as they come under the one-dimensional category. Hence, the only option left is (c) Pie chart.
Complete step by step answer:
Let us first define what a two – dimensional diagram is. Before that let us first see what one – dimensional diagram is. A diagram in which the size of only one dimension, i.e. the length is fixed in proportion to the value of the data is called a dimensional diagram. Such diagrams are also popularly called bar diagrams. An example is given below:
Now, let us define a two-dimensional diagram. In two dimensional diagrams, the areas of the diagrams are used to represent the magnitudes. Rectangles, squares and circles with area proportional to the observations are used to represent each category of these, circles are most commonly used. Such diagrams are called pie – diagrams. An example of a pie – chart is:
So, we observe from the options that the first option (a) Pie chart is our required answer.
Hence, the two-dimensional diagram is the Pie chart.
So, the correct answer is “Option A”.
Note: Observe the options, as we have already seen that the example of one – dimensional diagram is a bar graph, so the options having “multiple bars” and “bar” is not possible as they come under the one-dimensional category. Hence, the only option left is (c) Pie chart.
Recently Updated Pages
Master Class 8 Social Science: Engaging Questions & Answers for Success
Master Class 8 English: Engaging Questions & Answers for Success
Class 8 Question and Answer - Your Ultimate Solutions Guide
Master Class 8 Maths: Engaging Questions & Answers for Success
Master Class 8 Science: Engaging Questions & Answers for Success
Master Class 9 General Knowledge: Engaging Questions & Answers for Success
Trending doubts
What is BLO What is the full form of BLO class 8 social science CBSE
Citizens of India can vote at the age of A 18 years class 8 social science CBSE
Full form of STD, ISD and PCO
Advantages and disadvantages of science
Right to vote is a AFundamental Right BFundamental class 8 social science CBSE
What are the 12 elements of nature class 8 chemistry CBSE