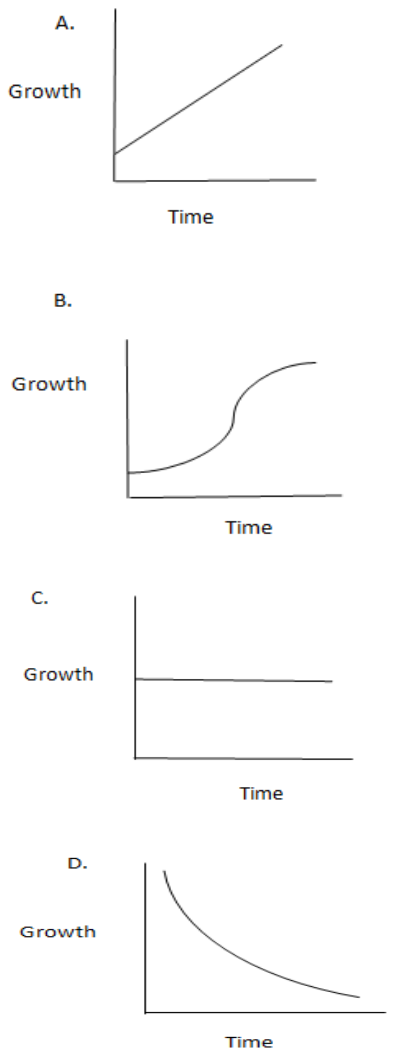
Which one is the correct graph for arithmetic growth?


Answer
558.9k+ views
Hint: Growth is defined as the steps involved in the development of an organism. It is the time from birth to the time of maturity or for some organisms to the time of death. It results from cellular multiplication, cell growth, cell expansion and also maturation.
Complete answer:
- Growth of an organism not only depends on internal signals but also external factors. The most important factor that affects growth is the availability of resources. When the resources are abundant growth occurs at a faster rate but when the resources become limiting the rate of growth also slows down.
- The rate of growth can be calculated by plotting a graph of growth vs time. Different organisms grow at different rates with time which has led to the formulation of four different types of growth- Arithmetic growth, Geometric growth, Sigmoid growth and Absolute growth. In Arithmetic growth the rate of growth is constant and growth occurs in an arithmetic progression.
- In Geometric growth the initial rate of growth is slow but it is followed by a rapid exponential rate. In Sigmoid growth the initial growth is slow, it is then followed by exponential growth, followed by stationary stage and finally a decline in growth. Absolute growth is the measurement of total growth per unit time.
Hence the correct answer is option A) which shows the graph for arithmetic growth.
Note: Growth is a very important step of development for all organisms without which they cannot survive. A knowledge about the different growth curves gives us an idea about the different forms of growth that different organisms undergo to survive and attain maturity.
Recently Updated Pages
Master Class 10 Computer Science: Engaging Questions & Answers for Success

Master Class 10 General Knowledge: Engaging Questions & Answers for Success

Master Class 10 English: Engaging Questions & Answers for Success

Master Class 10 Social Science: Engaging Questions & Answers for Success

Master Class 10 Maths: Engaging Questions & Answers for Success

Master Class 10 Science: Engaging Questions & Answers for Success

Trending doubts
What is the median of the first 10 natural numbers class 10 maths CBSE

Which women's tennis player has 24 Grand Slam singles titles?

Who is the Brand Ambassador of Incredible India?

Why is there a time difference of about 5 hours between class 10 social science CBSE

Write a letter to the principal requesting him to grant class 10 english CBSE

A moving boat is observed from the top of a 150 m high class 10 maths CBSE


