


y-axis on velocity time graph represents
A) Instantaneous velocity
B) Average velocity
C) Mean velocity
D) None of the above
Answer
573.9k+ views
Hint: A velocity-time graph represents velocity on the y-axis and time on the x-axis. Average velocity refers to the total velocity recorded during the entire motion of a body whereas mean velocity refers to the mean of different velocities recorded at different times of motion of the body. At the same time, instantaneous velocity relates the velocity with a particular instant of time.
Complete answer:
We know that a velocity-time graph represents velocity on the y-axis and time on the x-axis. We also know that the SI unit of velocity is $m{{s}^{-1}}$ and that of time is $s$. Thus, if we plot a velocity $(m{{s}^{-1}})$ -time $(s)$ graph for the motion of a uniformly accelerating body, we have
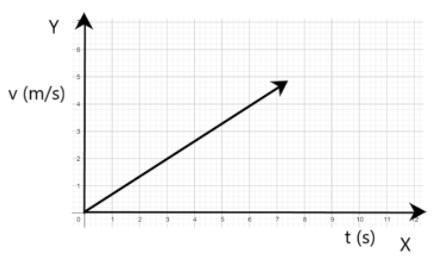
From the graph, it is clear that the body is undergoing uniform acceleration as the change in velocity at any time interval is the same. Also, it is clear from the graph that different velocities of the body are recorded at different times or different instants of time. These velocities recorded at different instants are termed as instantaneous velocities. For example, the instantaneous velocity of the given body at an instant $t=3s$ is equal to $2m{{s}^{-1}}$. Similarly, the instantaneous velocity of the given body at an instant $t=6s$ is equal to $4m{{s}^{-1}}$.
Thus, the correct answer is option A.
Additional information:
Average velocity refers to the total velocity recorded during the entire motion of a body whereas mean velocity refers to the mean of different velocities recorded at different times of motion of the body.
Note:
As already mentioned, the SI unit of velocity is $m{{s}^{-1}}$ and that of time is $s$. The graph drawn above follows these SI units. Here, it is to be noted that it is not necessary to plot velocity-time graphs with their SI units. Thus, other units like $kmph$ and $mph$ can also be used to plot velocity-time graphs. Students can also get a fair idea about the type of velocity recorded in a velocity-time graph from the unit of velocity. Clearly, velocities are usually recorded per second, per minute or per hour.
Complete answer:
We know that a velocity-time graph represents velocity on the y-axis and time on the x-axis. We also know that the SI unit of velocity is $m{{s}^{-1}}$ and that of time is $s$. Thus, if we plot a velocity $(m{{s}^{-1}})$ -time $(s)$ graph for the motion of a uniformly accelerating body, we have
From the graph, it is clear that the body is undergoing uniform acceleration as the change in velocity at any time interval is the same. Also, it is clear from the graph that different velocities of the body are recorded at different times or different instants of time. These velocities recorded at different instants are termed as instantaneous velocities. For example, the instantaneous velocity of the given body at an instant $t=3s$ is equal to $2m{{s}^{-1}}$. Similarly, the instantaneous velocity of the given body at an instant $t=6s$ is equal to $4m{{s}^{-1}}$.
Thus, the correct answer is option A.
Additional information:
Average velocity refers to the total velocity recorded during the entire motion of a body whereas mean velocity refers to the mean of different velocities recorded at different times of motion of the body.
Note:
As already mentioned, the SI unit of velocity is $m{{s}^{-1}}$ and that of time is $s$. The graph drawn above follows these SI units. Here, it is to be noted that it is not necessary to plot velocity-time graphs with their SI units. Thus, other units like $kmph$ and $mph$ can also be used to plot velocity-time graphs. Students can also get a fair idea about the type of velocity recorded in a velocity-time graph from the unit of velocity. Clearly, velocities are usually recorded per second, per minute or per hour.
Recently Updated Pages
Master Class 11 Computer Science: Engaging Questions & Answers for Success
Master Class 11 Business Studies: Engaging Questions & Answers for Success
Master Class 11 Economics: Engaging Questions & Answers for Success
Master Class 11 English: Engaging Questions & Answers for Success
Master Class 11 Maths: Engaging Questions & Answers for Success
Master Class 11 Biology: Engaging Questions & Answers for Success
Trending doubts
One Metric ton is equal to kg A 10000 B 1000 C 100 class 11 physics CBSE
There are 720 permutations of the digits 1 2 3 4 5 class 11 maths CBSE
Discuss the various forms of bacteria class 11 biology CBSE
Draw a diagram of a plant cell and label at least eight class 11 biology CBSE
State the laws of reflection of light
Explain zero factorial class 11 maths CBSE