

How to Read and Solve Pedigree Chart Questions for Exams
Pedigree analysis is an essential tool in genetics used to trace the inheritance of traits and disorders across generations in a family. By creating a family tree diagram, called a pedigree chart, scientists and healthcare professionals can observe how certain characteristics, such as genetic conditions or specific physical attributes, are passed from parents to their children. This method is especially useful in human genetics, as controlled breeding experiments (like those performed on plants or animals) cannot be ethically conducted in people.
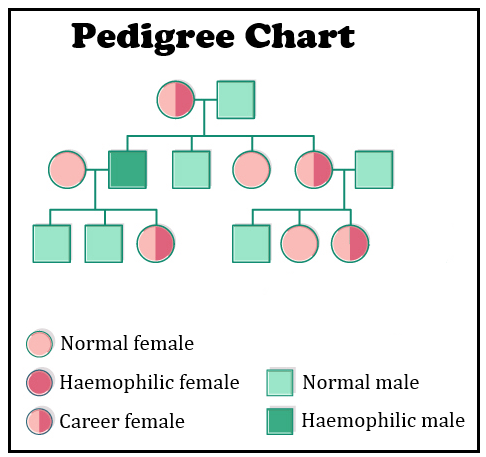
A pedigree chart uses standardized symbols to represent each family member and their relationships. Males are shown as squares, while females are circles. A horizontal line connecting a square and a circle represents a marriage. A vertical line descending from this pair leads to their offspring. Shaded symbols indicate individuals who express a particular trait or disorder being studied. Unshaded symbols denote unaffected people, and partially shaded shapes may represent carriers for certain conditions.
The main aim of pedigree analysis is to determine how specific genes or genetic disorders are inherited within a family. It helps scientists identify the transmission pattern, which can be autosomal dominant, autosomal recessive, X-linked dominant, or X-linked recessive. This knowledge is vital for medical counseling, predicting disease risks, diagnosing inherited conditions, and understanding how genes behave over generations.
Pedigree Chart Symbols and Their Meanings
| Symbol | Meaning |
|---|---|
| Square (□) | Male |
| Circle (○) | Female |
| Shaded Square/Circle | Affected Male/Female |
| Half-Shaded | Carrier (for recessive or sex-linked traits) |
| Horizontal line | Mating/Marriage |
| Vertical line | Descent/Offspring |
Types of Inheritance Patterns Observed in Pedigrees
| Inheritance Type | Main Features | Examples |
|---|---|---|
| Autosomal Dominant | Trait appears in every generation, affects both sexes equally | One parent usually affected |
| Autosomal Recessive | Trait may skip generations, both sexes equally affected | Parents can be unaffected carriers |
| X-linked Dominant | Often more severe in males, all daughters of affected father are affected | Expressed in both genders |
| X-linked Recessive | More common in males, mother can be a carrier | Affected males usually from carrier mothers |
Key Steps in Pedigree Analysis
-
Gather information about several generations of a family and identify individuals who are affected by a trait or disorder.
-
Draw the pedigree chart using standard symbols to represent each person, their gender, affected status, and relationships.
-
Analyze the chart to determine how the trait is passed—note whether it appears in every generation or skips generations, and whether one sex is more affected.
-
Based on patterns, infer if the inheritance is dominant, recessive, autosomal, or sex-linked.
-
Use this information for risk assessment, diagnosis, and genetic counseling.
Example of Pedigree Analysis
Suppose a pedigree chart shows a disorder in each generation, affecting both males and females. This suggests autosomal dominant inheritance. If an unaffected couple has an affected child, it points to autosomal recessive inheritance.
Scientific Significance of Pedigree Analysis
Pedigree analysis is important for tracing genetic disorders, such as hemophilia, cystic fibrosis, or sickle cell anemia. Understanding the inheritance pattern helps medical professionals predict risks, advise families, and guide decision-making for future offspring.
Important Definitions
| Term | Definition |
|---|---|
| Pedigree Chart | A family tree diagram showing inheritance of traits through generations |
| Carrier | An individual who has one copy of a recessive allele but does not show symptoms |
| Autosomal | Refers to chromosomes not involved in determining gender |
| Sex-linked | Traits determined by genes on X or Y chromosomes |
Further Learning and Practice
Sample Practice Question
Consider a pedigree where only males are affected and the disease skips generations. What type of inheritance is most likely observed?
Answer: X-linked recessive.
Understanding pedigree analysis gives students, families, and teachers insight into the continuity of genetic traits and helps in predicting, diagnosing, and managing inherited conditions with confidence.


FAQs on Pedigree Analysis: Understanding Family Genetic Inheritance
1. What is pedigree analysis?
Pedigree analysis is a genetic tool used to study the inheritance patterns of specific traits or disorders through a family tree diagram. It helps in tracking how a genetic trait is transmitted across generations and in predicting the likelihood of its occurrence in offspring. Key features include standardized pedigree symbols, identification of autosomal and sex-linked inheritance, and practical application for genetic counseling and exams.
2. What are the commonly used symbols in a pedigree chart?
Standard pedigree symbols include:
- Square (□): Unaffected male
- Filled Square (■): Affected male
- Circle (○): Unaffected female
- Filled Circle (●): Affected female
- Half-filled shapes: Carriers (commonly for sex-linked traits)
- Horizontal line: Marriage/mating
- Vertical lines: Offspring
These symbols help in clearly representing each individual's genetic status within a family tree.
3. How is an autosomal dominant trait identified in a pedigree chart?
Autosomal dominant traits are recognized by the following features:
- The trait appears in every generation (no skipping)
- Both males and females are equally affected
- Affected individuals usually have at least one affected parent
These indicators help in distinguishing autosomal dominant inheritance from other patterns.
4. How do you distinguish between autosomal recessive and autosomal dominant inheritance in pedigrees?
Autosomal recessive inheritance is characterized by:
- Traits can skip generations
- Unaffected parents can have affected children
- Both sexes are equally affected
Autosomal dominant inheritance shows:
- Trait present in every generation
- At least one parent is affected
- Both sexes equally affected
Examining these features helps differentiate between the two types in pedigree charts.
5. What information can a pedigree chart provide?
A pedigree chart helps in:
- Determining the pattern of inheritance of traits or disorders
- Identifying carriers of genetic conditions
- Predicting genetic risk for future generations
- Analyzing the possibility of dominant, recessive, X-linked, or Y-linked inheritance
It is an essential tool for genetics studies and medical counseling.
6. How can you tell if a trait is X-linked recessive using a pedigree?
X-linked recessive traits are typically identified by:
- More affected males than females
- Affected males often born to carrier mothers
- The trait may skip generations
- Affected fathers do not pass the trait to their sons
Recognizing these clues helps confirm X-linked recessive inheritance in pedigrees.
7. What is the significance of a carrier in pedigree analysis?
Carriers are individuals who have one copy of a mutated gene but do not show symptoms. They play a crucial role in:
- Passing on recessive genetic traits, especially for autosomal recessive and X-linked disorders
- Identifying potential risk in offspring
- Detecting hidden inheritance patterns for exam questions
Carrier status is often represented by a half-shaded symbol in pedigrees.
8. What are the steps to solve pedigree analysis questions in NEET and board exams?
To effectively solve pedigree-based questions:
1. Identify symbols: Note affected, unaffected, and carrier individuals.
2. Check pattern: Observe if the trait skips generations or affects both sexes equally.
3. Determine linkage: Decide if inheritance is autosomal or sex-linked.
4. Conclude inheritance type: Justify your answer with clear evidence from the chart.
Practicing with various exam-style pedigrees strengthens these skills.
9. Why is pedigree analysis important in genetics?
Pedigree analysis is important because:
- It tracks the inheritance of genes and genetic disorders across generations
- Enables prediction of genetic risks in families
- Supports early diagnosis and counseling
- Is frequently tested in medical entrance and board exams, requiring strong conceptual understanding
10. What is the difference between genotype and phenotype in pedigree analysis?
Genotype refers to the genetic makeup (allele combination) of an individual, while phenotype is the observable trait or characteristic. In pedigrees:
- Genotype determines if someone is a carrier, affected, or unaffected
- Phenotype is what is visually represented by the symbol shading
This distinction is essential for accurate pedigree interpretation.
11. What are the weightage and importance of pedigree analysis in NEET and board exams?
Pedigree analysis is a high-yield topic in exams:
- NEET UG: 1–2 questions, moderate level (from ‘Principles of Inheritance and Variation’)
- CBSE class 12: 1–2 questions, easy to moderate
- ICSE class 10: Commonly 1 question
Mastering this topic ensures stronger performance in genetics sections of competitive and board examinations.
12. Can you give an example of a commonly asked pedigree analysis question?
Example: "Given a pedigree where shaded circles and squares indicate affected individuals, determine whether the trait is autosomal dominant, autosomal recessive, or X-linked. Justify your answer."
To solve:
- Examine if every generation is affected (dominant) or if the trait skips generations (recessive)
- Assess the male/female ratio for sex linkage
- Provide logical reasoning based on observed patterns


