


Data Handling and Representation Class 6 important questions with answers PDF download
1. What is raw data?
Ans: Raw data is the data collected in its original form without being organised.
2. Define frequency in the context of data handling.
Ans: Frequency refers to the number of times a particular data value occurs.
3. What is a tally mark?
Ans: Tally marks are a way of recording and counting frequencies using vertical lines in groups of five.
4. Which graph is used to represent numerical data using bars?
Ans: A bar graph.
5. What is the first step in organizing data?
Ans: Collecting and recording the data.
6. What is the importance of data handling in daily life?
Ans: Data handling helps in organizing and interpreting information for better decision-making, such as analyzing survey results or tracking expenses.
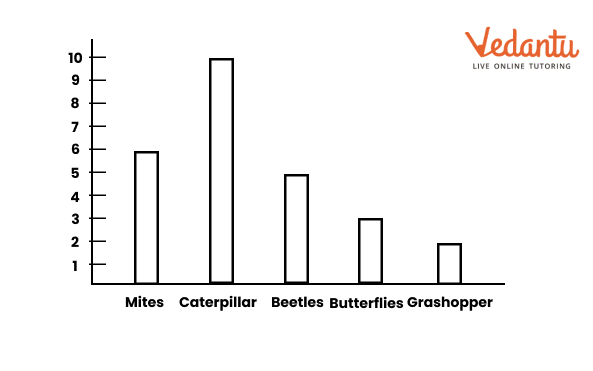
7. Samantha visited a tea garden and collected data on the insects and critters she saw there. Here is the data she collected-
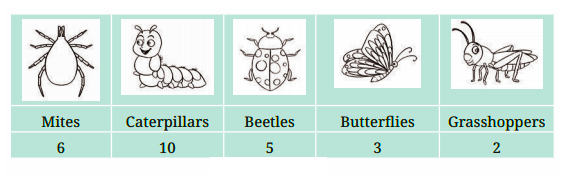
Help her prepare a bar graph representing this data.
Ans:
8. Find the range of the data: 8, 12, 5, 15, 10.
Ans: Range = Highest value - Lowest value = 15 - 5 = 10.
9. Explain how pictographs are used to represent data.
Ans: A pictograph uses pictures or symbols to represent data, where each picture corresponds to a specific number.
10. What is a line plot?
Ans: A line plot is a graph that displays data along a number line using Xs or dots to show frequencies.
11. Faiz prepared a frequency distribution table of data on the number of wickets taken by Jaspreet Bumrah in his last 30 matches:
(a) What information is this table giving?
(b) What may be the title of this table?
(c) What caught your attention in this table?
(d) In how many matches has Burnrah taken 4 wickets?
(e) Mayank says “If we want to know the total number of wickets he has taken in his last 30 matches, we have to add the numbers 0, 1, 2, 3,……..up to 7.” Can Mayank get the total number of wickets taken in this way? Why?
(f) How would you correctly figure out the total number of wickets taken by Bumrah in his last 30 matches, using this table?
Ans: (a) The information in the table gives an overview of the number of matches in which he took wickets from 0 to 7.
(b) Frequency distribution table indicating the bowling performance of Jaspreet Bumrah.
(c) Bumrah has taken 3 or more wickets in most of the matches.
(d) Three matches
(e) No
(f) He can get the correct total, by adding the following points.
(2 × 0) + (4 × 1) + (6 × 2) + (8 × 3) + (3 × 4) + (5 × 5) + (1 × 6) + (1 × 7)
= 0 + 4 + 12 + 24 + 12 + 25 + 6 + 7
= 90
12. Mudhol Hounds (a type of breed of Indian dogs) are largely found in North Karnataka’s Bagalkote and Vijaypura districts. The government took the initiative to protect this breed by providing support to those who adopted these dogs. Due to this initiative, the number of these dogs increased. The number of Mudhol dogs in six villages of Karnataka is as follows-
Village A: 18, Village B: 36, Village C: 12, Village D: 48, Village E: 18, Village F: 24
Prepare a pictograph and answer the following questions:
(a) What will be a useful scale or key to draw this pictograph?
(b) How many symbols will you use to represent the dogs in Village B?
(c) Kamini said that the number of dogs in Village B and Village D together will be more than the number of dogs in the other 4 villages. Is she right? Give reasons for your response.
Ans:
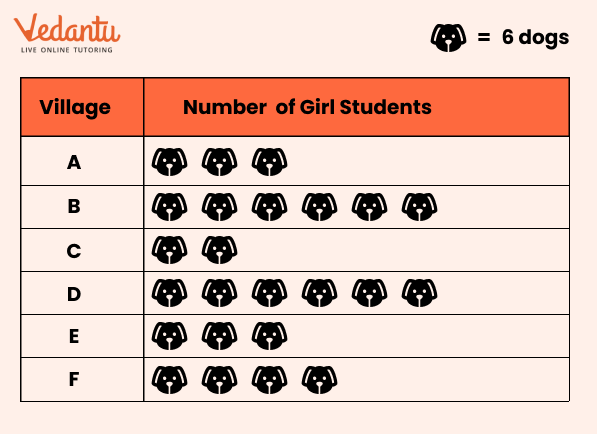
(a) 1 * = 6 dogs will be a useful scale or key to draw this pictograph.
(b) 6 symbols.
(c) Yes, because Total no. of dogs in villages B and D = 6 + 8 = 14 dogs = 14 × 6 = 84 dogs
Total no. of dogs in remaining 4 villages = 3 + 2 + 3 + 4 = 12 dogs = 12 × 6 = 72 dogs
13. Calculate the mean of the following data:
Data: 6, 8, 10, 5, 7.
Ans: Mean = (Sum of all data values) ÷ (Number of values) = (6 + 8 + 10 + 5 + 7) ÷ 5 = 36 ÷ 5 = 7.2.
14. Explain the differences between a bar graph and a histogram.
Ans:
15. The number of female students in each class of a school is depicted by a pictograph:

Observe this pictograph and answer the following questions:
(a) Which class has the least number of girl students?
(b) What is the difference between the number of girls in Classes 5 and 6?
(c) If 2 more girls were admitted in Class 2, how would the graph change?
(d) How many girls are there in Class 7?
Ans: (a) Class 8
(b) Number of Girls in class 6 = 4 × 4 = 16
Number of Girls in class 5 = 4 × 3.5 = 14
Hence difference = 16 – 14 = 2
(c) Five full symbols of a girl
(d) 3 × 4 = 12 girls.
16. China listed the various means of transport that passed across the road in front of his house from 9 am to 10 am:
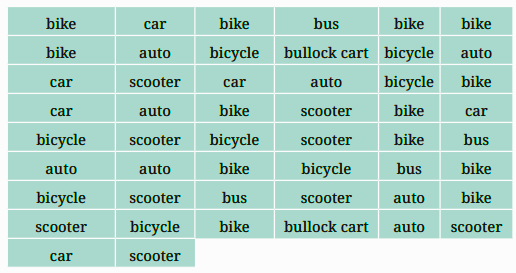
(a) Prepare a frequency distribution table for the data.
(b) Which means of transport was used the most?
(c) If you were there to collect this data, how could you do it? Write the steps or process.
Ans:
(a)

(b) Bike
(c) Only like this
17. Roll a die 30 times and record the number you obtain each time. Prepare a frequency distribution table using tally marks. Find the number that appeared:
(a) The minimum number of times.
(b) The maximum number of times.
(c) Find numbers that appeared an equal number of times.
Ans: Let the outcomes of 30 times roll of a die be
6, 2, 3, 5, 6, 4, 1, 1, 2, 5
3, 4, 1, 1, 3, 5, 2, 2, 1, 1
6, 2, 3, 5, 1, 2, 2, 3, 4, 2

(a) 4 and 6
(b) 2
(c) 4 and 6
18. Find the mode of the data:
Data: 3, 7, 7, 10, 10, 10, 15, 15.
Ans: Mode = The number that appears most frequently = 10.
Practise Extra Questions For Your Test Paper
1. Pooja collected data on the number of tickets sold at the Bhopal railway station for a few different cities of Madhya Pradesh over 2 hours.
She used this data and prepared a bar graph on the board to discuss the data with her students, but someone erased a portion of the graph.
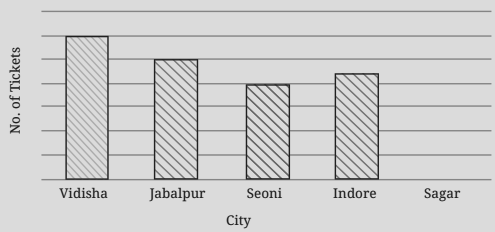
(a) Write the number of tickets sold for Vidisha above the bar.
(b) Write the number of tickets sold for Jabalpur above the bar.
(c) The bar for Vidisha is 6 unit lengths and the bar for Jabalpur is 5 unit lengths. What is the scale for this graph?
(d) Draw the correct bar for Sagar.
(e) Add the scale of the bar graph placing the correct numbers on the vertical axis.
(f) Are the bars for Seoni and Indore correct in this graph? If not, draw the correct bar(s).
Solution:
(a) 24 tickets
(b) 20 tickets
(c) 1 unit length = 4 tickets
(d)
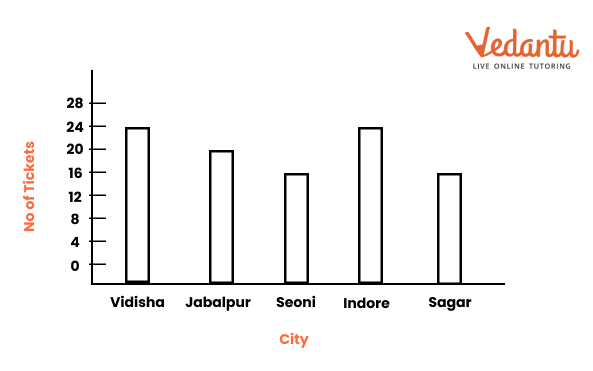
(e)

(f) No. The current graph is shown in (d) and (e) above.
2. The following pictograph shows the number of tractors in five different villages.
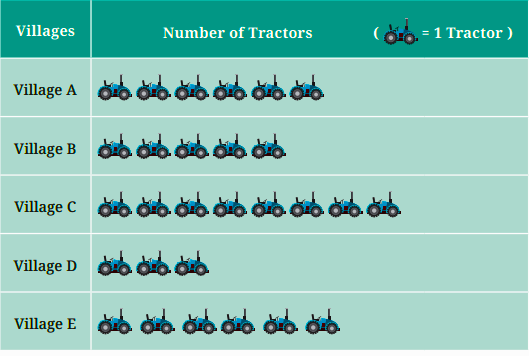
Observe the pictograph and answer the following questions-
(a) Which village has the smallest number of tractors?
(b) Which village has the most tractors?
(c) How many more tractors does Village C have than Village B?
(d) Komal says, “Village D has half the number of tractors as Village E.” Is she right?
Solution:
(a) Village D
(b) Village C
(c) 3 more tractors
(d) Yes.
3. A survey of 120 school students was conducted to find out which activity they preferred to do in their free time.
Draw a bar graph to illustrate the above data taking the scale of 1 unit length = 5 students. Which activity is preferred by most students other than playing?
Solution:

4. Pari wants to respond to the questions given below. Put a tick (✓) for the questions where she needs to carry out data collection and put a cross (✗) for the questions where she doesn’t need to collect data. Discuss your answers in the classroom.
(a) What is the most popular TV show among her classmates? ⬜
(b) When did India get independence? ⬜
(c) How much water is getting wasted in her locality? ⬜
(d) What is the capital of India? ⬜
Solution:
(a) What is the most popular TV show among her classmates? ✅
(b) When did India get independence? ❌
(c) How much water is getting wasted in her locality? ✅
(d) What is the capital of India? ❌
5. China listed the various means of transport that passed across the road in front of his house from 9 am to 10 am:

(a) Prepare a frequency distribution table for the data.
(b) Which means of transport was used the most?
(c) If you were there to collect this data, how could you do it? Write the steps or process.
Solution:
(a)
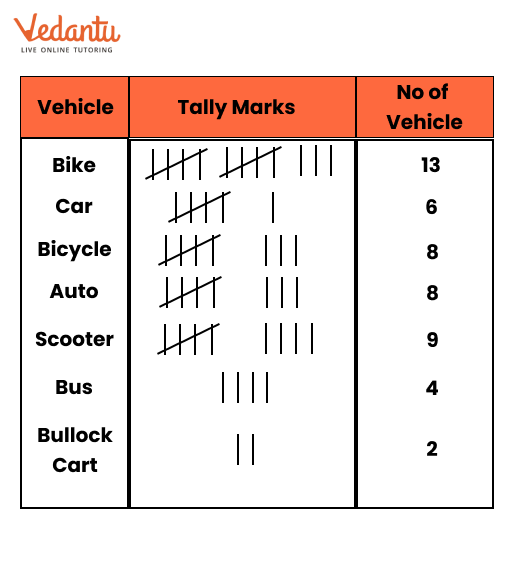
(b) Bike
(c) Only like this
The set of important questions that are given on this page from CBSE Class 6 Maths Chapter 4 Data Handling and Representation. This variety of extra questions will help you to secure high marks on your test papers.
Additionally, the short answer questions will be useful for quick practise. Also, make your preparation simple and easy.
Important Study Materials for Class 6 Maths Chapter 4 Data Handling and Representation
CBSE Class 6 Maths Chapter-wise Important Questions
Important Related Links for CBSE Class 6 Maths

FAQs on CBSE Important Questions for Class 6 Maths Data Handling and Representation - 2025-26
1. What is data handling in Class 6 Maths Chapter 4?
Data handling means collecting, organizing, and presenting information in a way that makes it easy to understand. In Vedantu’s explanation, this includes tally marks, bar graphs, pictographs, and more.
2. Why is learning data handling in maths important for Class 6 students?
It helps students understand how to organise numbers and represent them visually, which is useful for making sense of real-life situations like surveys or analysing scores.
3. What is the difference between raw data and organised data in Class 6 Chapter 4?
Raw data is unorganised information collected as it is, while organised data is arranged neatly in tables or charts for better understanding.
4. How do tally marks help in Class 6 Maths Chapter 4 Data Handling?
Tally marks make counting easy by grouping data into sets of 5, which saves time and avoids errors during calculations.
5. What is a bar graph, and why is it important in Class 6 Maths Chapter 4 Data Representation?
A bar graph is a chart that uses bars to show data. It is important because it makes comparing categories (like marks or sales) simple and visually appealing.
6. What is the role of frequency tables in Class 6 Maths Chapter 4?
Frequency tables organise data by showing how often each number or category appears, making the data easy to analyse.
7. How is a pictograph different from a bar graph in Class 6 Maths Chapter 4 Data Representation?
A pictograph uses pictures or symbols to represent data, while a bar graph uses bars. Pictographs are more colourful and fun, but bar graphs are better for precise data.
8. Can you explain the term ‘range’ in Class 6 Maths Chapter 4?
The range is the difference between the highest and lowest values in a data set. It tells us how spread out the data is.
9. What are the most important questions from Vedantu’s Class 6 Maths Chapter 4 for exams?
Focus on questions about drawing bar graphs, creating frequency tables, and calculating range. These topics are the most asked in exams.
10. How does Vedantu make Maths Chapter 4 Data Handling easier for Class 6 students?
Vedantu simplifies the chapter with clear explanations, solved examples, and fun practice questions that build confidence and clarity in data handling.