


If in hydrogen atom, radius of \[{n^{th}}\] Bohr orbits is \[{r_n}\], frequency of revolution of electron in \[{n^{th}}\] orbit is \[{f_n}\], choose the correct option.
A. 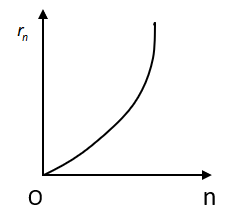
B. 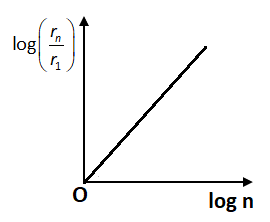
C. 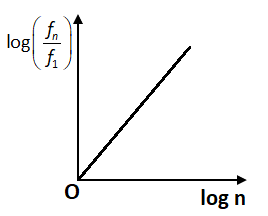
D. Both A and B
Answer
233.1k+ views
Hint:To find the correct graph we need to use the equation for radius of orbit given by Bohr's atomic theory so that we get the relationship between the terms like radius of the orbit, principal quantum number(n), atomic number(Z) and frequency(f).
Formula used:
According to the Bohr's atomic theory,
\[r = \dfrac{{{n^2}{h^2}}}{{4{\pi ^2}m{e^2}}} \times \dfrac{1}{Z}\]
Where n is an integer, \[r\] is the radius of orbit, n is the principal quantum number of the orbit and Z is the atomic number.
Complete step by step solution:
Let us understand each option one by one. As we know from Bohr's atomic theory,
\[{r_n} \propto \dfrac{{{n^2}}}{Z}\]
Here the radius of \[{n^{th}}\] orbit \[{r_n} \propto {n^2}\]. The graph between \[{r_n}\] and n is an increasing parabola. So, in option A, the graph shows the same condition so the first graph is correct.
Also, we can also write \[{r_1} \propto {(1)^2}\] or \[{r_1} \propto {1^2}\]
Now the ratio is given as,
\[\left( {\dfrac{{{r_n}}}{{{r_1}}}} \right) = {\left( {\dfrac{n}{1}} \right)^2 \\ }\]
\[\Rightarrow \log \left( {\dfrac{{{r_n}}}{{{r_1}}}} \right) = 2\log n \\ \]
By comparing this equation with the straight-line equation \[y = mx + c\], we have graph between \[\log \left( {\dfrac{{{r_n}}}{{{r_1}}}} \right)\] and \[\log n\] will be a straight line which is passing from the origin. So, in option B, the graph shows the positive increasing straight line and thus is the correct option.
Similarly, the graph between \[\log \left( {\dfrac{{{f_n}}}{{{f_1}}}} \right)\]and \[\log n\] will be a straight line which is passing from the origin but in a negative slope. In option C, the graph is not representing the negative slope and hence is not the correct answer. Therefore, both the options A and B show the correct graph.
Hence option D is the correct answer.
Note: The Bohr model of an atom came into existence with some modification of Rutherford’s model of an atom. Bohr’s theory modified the atomic structure of the model by explaining that electrons will move in fixed orbitals or shells and each of the orbitals or shells has its fixed energy.
Recently Updated Pages
JEE Main 2023 April 6 Shift 1 Question Paper with Answer Key
JEE Main 2023 April 6 Shift 2 Question Paper with Answer Key
JEE Main 2023 (January 31 Evening Shift) Question Paper with Solutions [PDF]
JEE Main 2023 January 30 Shift 2 Question Paper with Answer Key
JEE Main 2023 January 25 Shift 1 Question Paper with Answer Key
JEE Main 2023 January 24 Shift 2 Question Paper with Answer Key
Trending doubts
JEE Main 2026: Session 2 Registration Open, City Intimation Slip, Exam Dates, Syllabus & Eligibility
JEE Main 2026 Application Login: Direct Link, Registration, Form Fill, and Steps
Understanding the Angle of Deviation in a Prism
Hybridisation in Chemistry – Concept, Types & Applications
How to Convert a Galvanometer into an Ammeter or Voltmeter
Understanding Uniform Acceleration in Physics
Other Pages
JEE Advanced Marks vs Ranks 2025: Understanding Category-wise Qualifying Marks and Previous Year Cut-offs
Dual Nature of Radiation and Matter Class 12 Physics Chapter 11 CBSE Notes - 2025-26
Understanding the Electric Field of a Uniformly Charged Ring
JEE Advanced Weightage 2025 Chapter-Wise for Physics, Maths and Chemistry
Derivation of Equation of Trajectory Explained for Students
Understanding Electromagnetic Waves and Their Importance