


How do you construct and interpret a circle diagram in math?
The Circle Diagram is a powerful graphical tool in electrical engineering, especially when analyzing the performance of induction motors. Representing complex electrical characteristics visually, it enables quick estimation of important operational parameters. By transforming mathematical relations into geometric representations, it links abstract electric quantities to intuitive spatial reasoning. This makes it a favored method among students and engineers for understanding machine behavior. JEE questions often probe these relationships using multiple concepts embedded in such diagrams.
What is the Circle Diagram?
At its core, the Circle Diagram is a geometric plot that captures the variation of current drawn by an induction motor under different loading conditions. It arises from the mathematical relationship between the stator current and parameters of the induction motor equivalent circuit. This makes it possible to visualize not just currents, but also associated variables such as torque, power factor, and efficiency, all as points or lines within a single diagram. JEE often tests the ability to extract multiple types of data from these diagrams quickly.
Physically, the Circle Diagram allows engineers to analyze how induction motors behave as external loads change, providing insights into performance limits and operational efficiency. For a familiar analogy, it is as if you have a ‘picture’ of the entire spectrum of the motor’s functioning—much like a stethoscope gives a doctor a direct window into a patient's heart activity.
Underlying Mechanism: How Does the Circle Diagram Work?
The Circle Diagram is derived from the induction motor’s equivalent circuit, which models the machine's electrical dynamics using resistances, reactances, and current sources. Through phasor analysis, mathematical relationships among voltage, current, and impedance pave the way for a graphical locus, which takes the form of a circle. A common misconception is that the diagram is purely empirical; however, its geometry strictly follows from physical laws like Ohm’s and Kirchhoff's laws.
When plotting the circle, each point represents a distinct operating condition—ranging from no-load to full-load. For instance, as the load on the motor increases, the point moves along the circumference, representing increased stator current and associated changes in performance metrics. This connection between circuit algebra and spatial geometry is why the circle plot is so insightful.
Labeling the circle diagram and interpreting its axes is crucial. The horizontal axis often represents the reference voltage, while the position of points correlates with operating quantities like input power and losses. In JEE, students may encounter tasks requiring them to relate labeled elements to theoretical quantities.
Construction Steps for the Circle Diagram
To draw a Circle Diagram for an induction motor, three essential tests must be conducted: the no-load test, the blocked rotor test, and the stator resistance test. Each provides necessary data for accurate plotting—a step sometimes overlooked by beginners, leading to inaccurate conclusions.
- No-load test: determines baseline power and power factor at zero load
- Blocked rotor test: reveals maximum possible current and its phase relationship
- Stator resistance test: yields ohmic losses in stator winding
A common misconception is that any three-phase test data suffice. Actually, these specific tests uniquely characterize the circle. Micro-example: Even if the rated voltage is changed, one must recompute each parameter for the correct locus.
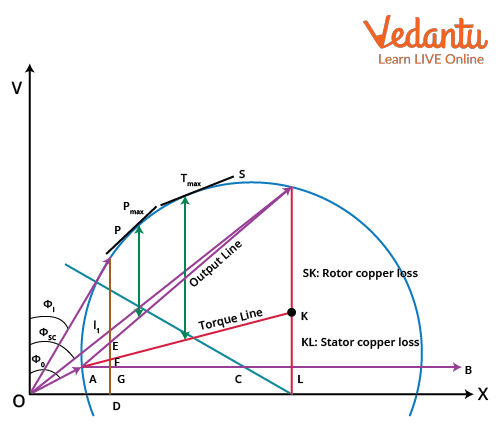
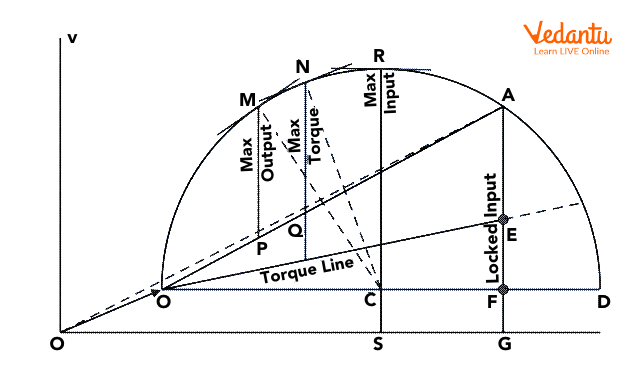
Once these values are measured, the next step is graphical construction. Use the no-load current and its angle as origin. Then, from the blocked-rotor condition, plot the phasor representing that current at its specific angle. Finally, form the locus connecting these endpoints—this is the circle itself. Carefully labeling the circle diagram points, such as output, input, torque, and losses, ensures correct reading.
Drawing the circle requires translating real values into graphical distances using an appropriate circle scale. Inaccuracy here can skew subsequent calculations, so precision is essential. The circle graph is called ‘universal’ because it applies regardless of machine size—provided the scaling is correct.
Key Components and Their Physical Meaning
A typical Circle Diagram consists of several labeled points and segments, each revealing a unique physical aspect. For example, the segment labeled from input to output represents losses, while the radius corresponds to stator current variation. To label the circle diagram correctly, one must grasp these correspondences. An analogy: each part of the circle relates to a ‘chapter’ in the motor’s performance story.
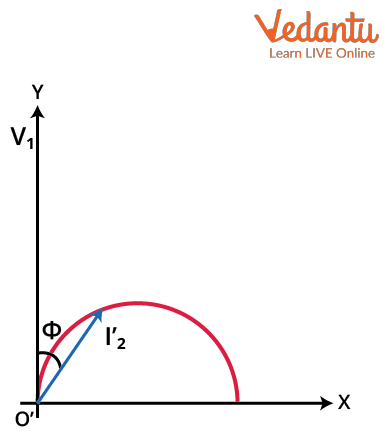
- Reference axis: typically denotes no-load current phasor
- No-load point: minimum input, tangent to the circle at no-load operation
- Blocked-rotor point: maximum current, tangent at full slip
- Output line: marks shaft power delivered
- Loss lines: separate out stator, rotor, and constant losses graphically
- Torque line: indicates produced torque at each operating point
A misconception here is that the circle’s diameter represents machine size—it actually corresponds to the ratio of voltage to total leakage reactance. In JEE, sometimes this component is hidden in ratio-type questions.
Interpreting the Circle Plot: Extracting Performance Metrics
The true utility of the Circle Diagram is its rich, visual encapsulation of useful motor performance parameters. By drawing lines and measuring distances within the diagram, one can determine slip, power factor, efficiency, and output torque for any operating condition. This powerful feature saves time, especially in exam settings.
For example, to determine efficiency, one reads input and output points and applies their ratio. To find slip, a specific segment within the diagram denotes its value. Unlike regular algebraic calculation, the circle graph quickly conveys trends and critical points—such as where maximum torque occurs or where losses peak.
A common misconception is that the diagram’s circle implies ideal operation. Actually, it accounts for non-idealities, as loss lines are built into its construction. In JEE, labeling all parts precisely and connecting geometric elements to physical quantities is frequently required.
The circle graph is also called a 'universal performance chart' in engineering practice. For instance, a small vertical movement on the graph might represent a large real-world change in output power.
Applications of the Circle Diagram
The Circle Diagram has its most prominent applications in analyzing and predicting the performance of induction motors. It is widely used for rapid computation of key points such as maximum power, maximum torque, and optimal operating efficiency—without repeated lengthy calculations. A micro-example: In maintenance, technicians may check if a motor operates within safe regions by referencing its circle picture.
- Determining safe and efficient loading ranges for induction motors
- Comparing performance of different motors visually
- Diagnosing abnormal losses or excessive slip through outlier points
- Designing controls for industrial automation using graphical methods
The diagram can also serve as a teaching tool, helping students visualize abstract relationships. In some regions, like the 'circle chart Korea,' graphical tools appear in certain national engineering exams or music rating systems—a reminder of the circle chart's flexibility beyond physics.
Physical Interpretation and Misconceptions
A key principle in physics is the connection between geometry and laws of nature. The Circle Diagram is a classic example—its circle results from the quadratic form of current versus slip. Many mistakenly think it is an empirical fit, but actually it is grounded in precise mathematical derivation from machine equations. An analogy: like an architect’s blueprint, it precisely defines each feature of the machine’s operation.
One short example helps clarify: If the supply voltage changes, the whole circle shifts in size, not just some points. This shows that all parameters are interdependent—a point JEE sometimes stresses in advanced questions.
The unit circle diagram conceptually relates in that both show parameter loci, but in induction motors, the specific physical meaning is tied to machine response.
Typical Circle Diagram Example
Imagine an induction motor tested at no-load and blocked rotor conditions. The respective currents and phase angles are plotted, the diameter of the circle set, and the rest of the performance metrics become instantly accessible. By reading distances on this diagram, engineers determine where maximum torque will occur—or, in an analogy, where a car’s maximum speed or fuel efficiency appears.
A misconception is that each point on the periphery is a possible state; rather, only those satisfying operational rules (like rated voltage) are meaningful. For JEE, careful discrimination is essential when interpreting diagram data.
Parts and Labeling of the Circle Diagram
To extract useful results, one must accurately label the circle diagram. The main parts to identify include input point, output segment, stator and rotor copper loss, and constant loss areas. Each is associated with physical processes within the motor, from resistive heating to electromagnetic torque generation. Reasoning through these associations in exams makes for consistent scoring.
- OA: No-load current
- AS: Range from no-load to blocked-rotor conditions
- Loss lines: Representing stator, rotor, and other losses
- Output line: Showing delivered shaft power
- Maximum power points: Located via tangents to the circle
- Torque segment: Indicates changing torque as load varies
It’s a misconception that ‘label the circle diagram’ means arbitrary letters; points must correspond to physically relevant quantities. In JEE, checking physical meaning prevents careless errors.
Summary Table: Major Measured Quantities
| Quantity | Physical Meaning |
|---|---|
| Input Point | Total electrical power supplied |
| Output Point | Shaft power delivered to load |
| Stator Loss Segment | Ohmic loss in stator windings |
| Rotor Loss Segment | Ohmic loss in rotor circuit |
| Constant Loss Area | Core and mechanical losses |
| Torque Line | Generated electromagnetic torque |
Practical Relevance and Further Exploration
The Circle Diagram continues to find applications in advanced analysis, automated control, and even in fields that borrow its logic, such as in the circle chart music awards for ranking purposes. Its core power lies in compactly conveying multivariable information—an advantage inspired by physics but effective in interdisciplinary contexts as well.
For learners seeking more, Vedantu offers extensive resources to consolidate such foundational concepts in electrical machines and applied physics. Exploring related principles, such as in Electromagnetic Induction Notes, can solidify command over the broader subject.
Conclusion
Mastering the Circle Diagram empowers students to analyze induction motor performance comprehensively and efficiently—a skill the JEE values highly. By combining geometric intuition with physics reasoning, the diagram transforms abstract relationships into accessible insights. Remember that clarity in labeling, an understanding of real-world meaning, and precision in construction are vital for accuracy. Advanced topics, while challenging, reward persistent practice and careful attention to conceptual links across electrical engineering topics.
FAQs on Understanding the Circle Diagram: A Complete Guide
1. What is a circle diagram and what is its significance in electrical engineering?
A circle diagram is a graphical method used to analyze the performance of electrical machines, especially induction motors and transformers. It presents complex test data in a simple, visual format, aiding students and engineers in understanding key characteristics and performance curves.
Key points include:
- Visual representation of machine parameters
- Determines efficiency, power factor, and output
- Helps in predicting performance under various loading conditions
- Commonly used for single-phase and three-phase induction motors
- Facilitates quick comparisons of machine behavior
2. Explain the construction steps for drawing a circle diagram of an induction motor.
The circle diagram is constructed using data from No Load and Blocked Rotor tests on the induction motor.
The typical steps include:
- Plot the no-load current (Io) and its phase angle with respect to voltage
- Plot the blocked rotor current (Isc) and its phase relationship
- Connect the two points and draw a semicircle with the diameter as the line joining them
- All operating points of the motor now lie on this circle
- Various performance parameters (output, losses, efficiency, power factor) can be found graphically from the circle
3. What information can be obtained from a circle diagram of an induction motor?
A circle diagram provides complete performance data of an induction motor using a single graphical tool.
The following can be directly obtained:
- Input current and power factor for any load condition
- Output power and torque at various loads
- Losses (iron, copper, mechanical)
- Efficiency and slip under operating conditions
- Maximum torque and slip positions
4. Why is the circle diagram called so?
The diagram is called a circle diagram because the locus of the tip of the current phasor, when the load changes, forms a circle. This property results from the graphical addition of the working and magnetizing components of current as load varies in an AC machine.
5. How can efficiency and power factor be determined from a circle diagram?
Efficiency and power factor are found by graphical measurements using the diagram's geometry and defined scales.
To determine:
- Efficiency: Measure the distances corresponding to output, input, and losses on the diagram, then use the formula Efficiency = Output/Input × 100%.
- Power Factor: Find the angle between the input current and voltage line, or use the projection of the current onto the voltage axis.
6. List the advantages of using a circle diagram for analyzing an induction motor.
The circle diagram simplifies complex calculations and gives a quick graphical overview of machine performance.
Main advantages:
- Saves time in finding performance parameters
- Shows all possible operating conditions at a glance
- Useful for rapid comparison of machines
- Helps in understanding impact of changes in design or supply voltage/frequency
7. Mention the limitations of the circle diagram method.
While useful, the circle diagram method has some limitations that students should note.
Limitations include:
- Only approximately accurate due to idealized assumptions
- Does not easily account for variation in parameters with temperature or frequency
- Not suitable for all machine types (mainly induction motors and transformers)
- Less accurate near extreme operating conditions
8. What tests are required to construct a circle diagram for an induction motor?
The two main tests needed are the No Load Test and Blocked Rotor Test.
These include:
- No Load Test: Measures current, power, voltage with the rotor running freely
- Blocked Rotor Test: Measures current, power, voltage with the rotor fixed (blocked) and a reduced voltage applied
9. How is slip represented on a circle diagram of an induction motor?
Slip is graphically represented by points along the circle corresponding to different load conditions.
- Zero slip (no load) is at one end of the semicircle
- Slip increases as we move along the circle towards the blocked-rotor point (maximum slip)
- The position on the circle gives the value of slip for that operating point
10. What are the applications of a circle diagram in transformer analysis?
Circle diagrams are also used to visualize transformer performance and operational limits.
Applications in transformers include:
- Predicting efficiency and regulation at different load levels
- Determining no-load and full-load current values
- Understanding how voltage and current change with loading
- Comparing different transformer designs rapidly
11. What is meant by the output line and the input line in a circle diagram?
The output line and input line are graphical constructions on the circle diagram to represent power output and input, respectively.
- Output line: A line drawn from the origin to a point representing the output power at a certain slip
- Input line: A line representing the total apparent power supplied to the motor at the same loading
12. Why is the circle diagram not suitable for synchronous machines?
The circle diagram is based on the current locus characteristics of induction machines and transformers, which differ from synchronous machines. Synchronous machines do not have a similar current variation with load, so the graphical approach does not apply accurately.