


The equation of shown in sinusoidal graph is:
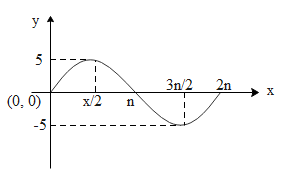
(A) $y=\sin x$
(B) $y=5\sin x$
(C) $y=10\sin x$
(D) $y=5\sin x$
Answer
233.1k+ views
Hint: We know that the sinusoidal function family refers to either sine or cosine waves since they are the same except for a horizontal shift. This function family is also called the periodic function family because the function repeats after a given period of time. The amplitude is the height from the centre line to the peak (or to the trough). Or we can measure the height from highest to lowest points and divide that by 2. The phase shift is how far the function is shifted horizontally from the usual position. The amplitude of the sine and cosine functions is the vertical distance between the sinusoidal axis and the maximum or minimum value of the function. In relation to sound waves, amplitude is a measure of how loud something is.
Complete step-by step answer:
We know that a sine wave, or sinusoid, is the graph of the sine function in trigonometry. A sinusoidal function is a function in sine or in cosine. The amplitude of a graph is the distance on the y axis between the normal line and the maximum or minimum. It is given by parameter a in function $y=asinb\left( x-c \right)+d=acosb\left( x-c \right)+d$.
It can be thus concluded that the frequency of a trigonometric function is the number of cycles it completes in a given interval. This interval is generally $2\pi$ radians (or ${{360}^{{}^\circ }}$$y=\sin x$) for the sine and cosine curves. This sine curve, $y=\sin x$, completes 1 cycle in the interval from 0 to $2\pi$ radians. Its frequency is 1 in the interval of $2\pi$. A mathematical model is a function that describes some phenomenon. For objects that exhibit periodic behaviour, a sinusoidal function can be used as a model since these functions are periodic. However, the concept of frequency is used in some applications of periodic phenomena instead of the period.
Therefore, the correct answer is $y=\sin x$.
Hence, the correct answer is Option A.
Note: We know that a waveform is an image that represents an audio signal or recording. It shows the changes in amplitude over a certain amount of time. The amplitude of the signal is measured on the y-axis (vertically), while time is measured on the x-axis (horizontally). A waveform is just a schematic that helps us understand sound waves. They measure an air molecule's displacement over time. We can adjust the amplitude of a waveform to make it louder or quieter, and we can adjust the frequency of a waveform to make the pitch higher or lower.
Recently Updated Pages
JEE Main 2023 April 6 Shift 1 Question Paper with Answer Key
JEE Main 2023 April 6 Shift 2 Question Paper with Answer Key
JEE Main 2023 (January 31 Evening Shift) Question Paper with Solutions [PDF]
JEE Main 2023 January 30 Shift 2 Question Paper with Answer Key
JEE Main 2023 January 25 Shift 1 Question Paper with Answer Key
JEE Main 2023 January 24 Shift 2 Question Paper with Answer Key
Trending doubts
JEE Main 2026: Session 2 Registration Open, City Intimation Slip, Exam Dates, Syllabus & Eligibility
JEE Main 2026 Application Login: Direct Link, Registration, Form Fill, and Steps
JEE Main Marking Scheme 2026- Paper-Wise Marks Distribution and Negative Marking Details
Understanding the Angle of Deviation in a Prism
Hybridisation in Chemistry – Concept, Types & Applications
How to Convert a Galvanometer into an Ammeter or Voltmeter
Other Pages
JEE Advanced Marks vs Ranks 2025: Understanding Category-wise Qualifying Marks and Previous Year Cut-offs
Laws of Motion Class 11 Physics Chapter 4 CBSE Notes - 2025-26
Waves Class 11 Physics Chapter 14 CBSE Notes - 2025-26
Mechanical Properties of Fluids Class 11 Physics Chapter 9 CBSE Notes - 2025-26
Thermodynamics Class 11 Physics Chapter 11 CBSE Notes - 2025-26
Units And Measurements Class 11 Physics Chapter 1 CBSE Notes - 2025-26