


The graph $AB$ shown in figure is a plot of temperature of a body in degree Celsius and degree Fahrenheit. Then

A. Slope of line $AB$ is $\dfrac{9}{5}$
B. Slope of line$AB$ is $\dfrac{5}{9}$
C. Slope of line $AB$ is $\dfrac{1}{9}$
D. Slope of line $AB$ is $\dfrac{3}{9}$
Answer
232.8k+ views
Hint: In this question, the concept of the slope of the straight line is used. As we know that one of the methods for calculating the slope of the straight we need two coordinate points on the linear line from which we can calculate the slope.
Complete step by step answer:
In this question, we have given a plot of temperature of a body in degree Celsius and degree Fahrenheit. We need to find the slope of the given graph.
As we know that the slope of the straight line can be calculated by using the expression,
$m = \dfrac{{{y_2} - {y_1}}}{{{x_2} - {x_1}}}......\left( 1 \right)$
Where, the coordinates of the linear line are $\left( {{x_1},{y_1}} \right)$ and $\left( {{x_2},{y_2}} \right)$.
Let us consider the given graph of the temperature of a body in degree Celsius and degree Fahrenheit as,
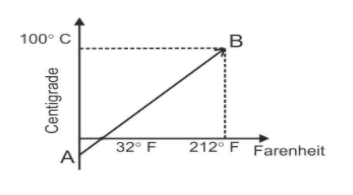
Now, in the given graph of the Celsius and the Fahrenheit scale, the coordinates are $\left( {32,0} \right)$ and $\left( {212,100} \right)$.
Now, we compare the coordinates that is $\left( {{x_1},{y_1}} \right)$ is equal to $\left( {32,0} \right)$ and $\left( {{x_2},{y_2}} \right)$ is equal to $\left( {212,100} \right)$.
Now, we substitute these coordinates in equation (1) as,
$ \Rightarrow m = \dfrac{{100 - 0}}{{212 - 32}}......\left( 1 \right)$
Now, we simplify the above calculation and get,
$ \Rightarrow m = \dfrac{{100}}{{180}}$
After simplification we get,
$\therefore m = \dfrac{5}{9}$
Therefore, the correct option is B.
Note: As we know that the boiling point temperature of the water in Fahrenheit scale is $212^\circ {\text{F}}$ and in the Celsius scale it is $100^\circ {\text{C}}$ while the freezing point temperature of the water in Fahrenheit scale is $32^\circ {\text{F}}$ and in the Celsius scale it is $0^\circ {\text{C}}$. The conversion of the Celsius scale to Fahrenheit scale can be done by the equation of relation between Celsius and Fahrenheit scale of temperature as,
$ \Rightarrow \dfrac{C}{5} = \dfrac{{F - 32}}{9}$
Complete step by step answer:
In this question, we have given a plot of temperature of a body in degree Celsius and degree Fahrenheit. We need to find the slope of the given graph.
As we know that the slope of the straight line can be calculated by using the expression,
$m = \dfrac{{{y_2} - {y_1}}}{{{x_2} - {x_1}}}......\left( 1 \right)$
Where, the coordinates of the linear line are $\left( {{x_1},{y_1}} \right)$ and $\left( {{x_2},{y_2}} \right)$.
Let us consider the given graph of the temperature of a body in degree Celsius and degree Fahrenheit as,
Now, in the given graph of the Celsius and the Fahrenheit scale, the coordinates are $\left( {32,0} \right)$ and $\left( {212,100} \right)$.
Now, we compare the coordinates that is $\left( {{x_1},{y_1}} \right)$ is equal to $\left( {32,0} \right)$ and $\left( {{x_2},{y_2}} \right)$ is equal to $\left( {212,100} \right)$.
Now, we substitute these coordinates in equation (1) as,
$ \Rightarrow m = \dfrac{{100 - 0}}{{212 - 32}}......\left( 1 \right)$
Now, we simplify the above calculation and get,
$ \Rightarrow m = \dfrac{{100}}{{180}}$
After simplification we get,
$\therefore m = \dfrac{5}{9}$
Therefore, the correct option is B.
Note: As we know that the boiling point temperature of the water in Fahrenheit scale is $212^\circ {\text{F}}$ and in the Celsius scale it is $100^\circ {\text{C}}$ while the freezing point temperature of the water in Fahrenheit scale is $32^\circ {\text{F}}$ and in the Celsius scale it is $0^\circ {\text{C}}$. The conversion of the Celsius scale to Fahrenheit scale can be done by the equation of relation between Celsius and Fahrenheit scale of temperature as,
$ \Rightarrow \dfrac{C}{5} = \dfrac{{F - 32}}{9}$
Recently Updated Pages
JEE Main 2023 April 6 Shift 1 Question Paper with Answer Key
JEE Main 2023 April 6 Shift 2 Question Paper with Answer Key
JEE Main 2023 (January 31 Evening Shift) Question Paper with Solutions [PDF]
JEE Main 2023 January 30 Shift 2 Question Paper with Answer Key
JEE Main 2023 January 25 Shift 1 Question Paper with Answer Key
JEE Main 2023 January 24 Shift 2 Question Paper with Answer Key
Trending doubts
JEE Main 2026: Session 2 Registration Open, City Intimation Slip, Exam Dates, Syllabus & Eligibility
JEE Main 2026 Application Login: Direct Link, Registration, Form Fill, and Steps
JEE Main Marking Scheme 2026- Paper-Wise Marks Distribution and Negative Marking Details
Understanding the Angle of Deviation in a Prism
Hybridisation in Chemistry – Concept, Types & Applications
How to Convert a Galvanometer into an Ammeter or Voltmeter
Other Pages
JEE Advanced Marks vs Ranks 2025: Understanding Category-wise Qualifying Marks and Previous Year Cut-offs
Laws of Motion Class 11 Physics Chapter 4 CBSE Notes - 2025-26
Waves Class 11 Physics Chapter 14 CBSE Notes - 2025-26
Mechanical Properties of Fluids Class 11 Physics Chapter 9 CBSE Notes - 2025-26
Thermodynamics Class 11 Physics Chapter 11 CBSE Notes - 2025-26
Units And Measurements Class 11 Physics Chapter 1 CBSE Notes - 2025-26