


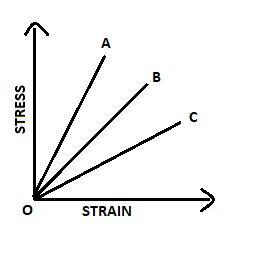
The stress-strain curves for brass, steel and rubber are shown in the figure. The lines A, B and C are for

(A) Rubber, brass and steel respectively
(B) Brass, steel and rubber respectively
(C) Steel, brass and rubber respectively
(D) Steel, rubber and brass respectively
Answer
233.1k+ views
Hint The slope of the stress-strain graph gives us the Young’s Modulus of elasticity . More the slope of the graph, more will be the value of Young’s Modulus of elasticity , more will be the elastic material .
Complete Step-by-step Solution
To identify which line belongs to which material , we will first learn about stress-strain diagrams in detail.
The graph that is given to us is –
The stress diagram can be drawn for any material. It tells us whether the substance is elastic or not. In simpler terms it tells us about the elasticity of any substance. The slope of different materials is different. Different materials can have very different values of slope. The ratio of stress to that of strain is called Young’s modulus. The slope of the graph gives us the value of Young’s modulus.
We are given three materials- steel, brass and rubber. Out of the three steel is the most elastic, rubber the least while the elasticity of brass lies in between the two.
Out of the three lines given in the curve. A has the maximum slope, C the minimum slope. And B in between . The Young’s Modulus for A is maximum making it the most elastic , C the least elastic and B in between.
We can draw the parallels in between the three-
A-maximum slope-most elastic-steel
B-moderate slope-medium elasticity- brass
C-minimum slope-least elastic-rubber
Hence, the correct option is C .
Note Young’s Modulus is a property of material. The area of the graph also helps us differentiate between brittle and ductile material.
Recently Updated Pages
JEE Main 2023 April 6 Shift 1 Question Paper with Answer Key
JEE Main 2023 April 6 Shift 2 Question Paper with Answer Key
JEE Main 2023 (January 31 Evening Shift) Question Paper with Solutions [PDF]
JEE Main 2023 January 30 Shift 2 Question Paper with Answer Key
JEE Main 2023 January 25 Shift 1 Question Paper with Answer Key
JEE Main 2023 January 24 Shift 2 Question Paper with Answer Key
Trending doubts
JEE Main 2026: Session 2 Registration Open, City Intimation Slip, Exam Dates, Syllabus & Eligibility
JEE Main 2026 Application Login: Direct Link, Registration, Form Fill, and Steps
JEE Main Marking Scheme 2026- Paper-Wise Marks Distribution and Negative Marking Details
Understanding the Angle of Deviation in a Prism
Hybridisation in Chemistry – Concept, Types & Applications
How to Convert a Galvanometer into an Ammeter or Voltmeter
Other Pages
JEE Advanced Marks vs Ranks 2025: Understanding Category-wise Qualifying Marks and Previous Year Cut-offs
Laws of Motion Class 11 Physics Chapter 4 CBSE Notes - 2025-26
Waves Class 11 Physics Chapter 14 CBSE Notes - 2025-26
Mechanical Properties of Fluids Class 11 Physics Chapter 9 CBSE Notes - 2025-26
Thermodynamics Class 11 Physics Chapter 11 CBSE Notes - 2025-26
Units And Measurements Class 11 Physics Chapter 1 CBSE Notes - 2025-26