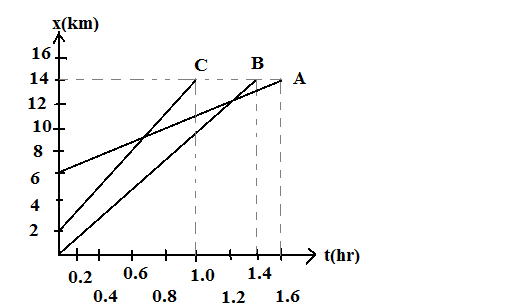
Which car has the highest speed and which car has the lowest speed?

Answer
232.8k+ views
Hint: Recall the various graphs in kinematics and what the properties of the graphs are. Also recall what area under the curve and slope of each graph gives. Answer accordingly to the data given in graphs.
Formula used:
Slope $ = \dfrac{{\Delta y}}{{\Delta x}} = \dfrac{{{y_2} - {y_1}}}{{{x_2} - {x_1}}}$
Complete step by step solution:
The given graph is a $x - t$ graph. We know that the slope of $x - t$ graph gives the speed. Thus the car whose slope is maximum has the maximum speed. Hence for these we need to find the slope in each case. We know,
Slope $ = \dfrac{{\Delta y}}{{\Delta x}} = \dfrac{{{y_2} - {y_1}}}{{{x_2} - {x_1}}}$
Thus,
Slope of A $ = \dfrac{{14 - 6}}{{1.6 - 0}} = \dfrac{8}{{1.6}} = 5km/hr$
Slope of B $ = \dfrac{{14 - 0}}{{1.4 - 0}} = \dfrac{{14}}{{1.4}} = 10km/hr$
Slope of C $ = \dfrac{{14 - 2}}{{1.0 - 0}} = \dfrac{{12}}{{1.0}} = 12km/hr$
After taking out the slopes, we infer that C has the maximum slope and A has the minimum slope.
Thus, C has the maximum speed and A has the minimum speed.
Additional Information:
There are three main motion graphs that tend to be studied in kinematics: displacement-time graphs, velocity-time graphs, and acceleration-time graphs. In all the three, time is present in the X-axis, while the others are present in Y-axis.
Following shows what does the slope and area of each graph corresponds to
Graphs are an easy way to study the nature of motion of a body. A curve in any of the graphs may not be a straight line; it can even be a curve.
Note: Do the calculations properly. Also do not make mistakes in interpreting the graph. Keep in mind the properties of all the graphs in kinematics within the scope of syllabus.
Formula used:
Slope $ = \dfrac{{\Delta y}}{{\Delta x}} = \dfrac{{{y_2} - {y_1}}}{{{x_2} - {x_1}}}$
Complete step by step solution:
The given graph is a $x - t$ graph. We know that the slope of $x - t$ graph gives the speed. Thus the car whose slope is maximum has the maximum speed. Hence for these we need to find the slope in each case. We know,
Slope $ = \dfrac{{\Delta y}}{{\Delta x}} = \dfrac{{{y_2} - {y_1}}}{{{x_2} - {x_1}}}$
Thus,
Slope of A $ = \dfrac{{14 - 6}}{{1.6 - 0}} = \dfrac{8}{{1.6}} = 5km/hr$
Slope of B $ = \dfrac{{14 - 0}}{{1.4 - 0}} = \dfrac{{14}}{{1.4}} = 10km/hr$
Slope of C $ = \dfrac{{14 - 2}}{{1.0 - 0}} = \dfrac{{12}}{{1.0}} = 12km/hr$
After taking out the slopes, we infer that C has the maximum slope and A has the minimum slope.
Thus, C has the maximum speed and A has the minimum speed.
Additional Information:
There are three main motion graphs that tend to be studied in kinematics: displacement-time graphs, velocity-time graphs, and acceleration-time graphs. In all the three, time is present in the X-axis, while the others are present in Y-axis.
Following shows what does the slope and area of each graph corresponds to
| Graph | Slope | Area |
| Displacement-time | Velocity | --- |
| Velocity-time | Acceleration | Displacement |
| Acceleration-time | --- | Velocity |
Graphs are an easy way to study the nature of motion of a body. A curve in any of the graphs may not be a straight line; it can even be a curve.
Note: Do the calculations properly. Also do not make mistakes in interpreting the graph. Keep in mind the properties of all the graphs in kinematics within the scope of syllabus.
Recently Updated Pages
JEE Main 2023 April 6 Shift 1 Question Paper with Answer Key

JEE Main 2023 April 6 Shift 2 Question Paper with Answer Key

JEE Main 2023 (January 31 Evening Shift) Question Paper with Solutions [PDF]

JEE Main 2023 January 30 Shift 2 Question Paper with Answer Key

JEE Main 2023 January 25 Shift 1 Question Paper with Answer Key

JEE Main 2023 January 24 Shift 2 Question Paper with Answer Key

Trending doubts
JEE Main 2026: Session 2 Registration Open, City Intimation Slip, Exam Dates, Syllabus & Eligibility

JEE Main 2026 Application Login: Direct Link, Registration, Form Fill, and Steps

Understanding the Angle of Deviation in a Prism

Hybridisation in Chemistry – Concept, Types & Applications

How to Convert a Galvanometer into an Ammeter or Voltmeter

Understanding Uniform Acceleration in Physics

Other Pages
JEE Advanced Marks vs Ranks 2025: Understanding Category-wise Qualifying Marks and Previous Year Cut-offs

Laws of Motion Class 11 Physics Chapter 4 CBSE Notes - 2025-26

Waves Class 11 Physics Chapter 14 CBSE Notes - 2025-26

Mechanical Properties of Fluids Class 11 Physics Chapter 9 CBSE Notes - 2025-26

Thermodynamics Class 11 Physics Chapter 11 CBSE Notes - 2025-26

Units And Measurements Class 11 Physics Chapter 1 CBSE Notes - 2025-26


