


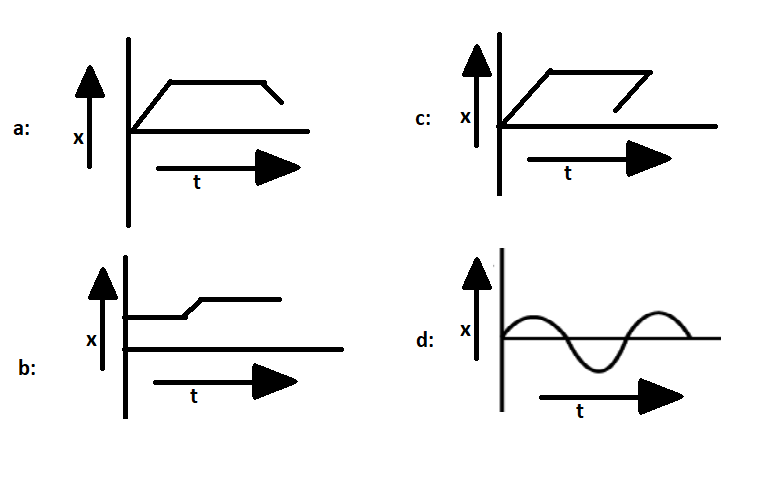
Which of the following position-time graphs does not exist in nature?
Answer
233.1k+ views
Hint: The slope of the position-time graph gives us the physical quantity called Velocity. Now as we know that if a particle changes its position it means that it had a displacement and this displacement consumes some amount of time. This relation of displacement to the time taken for it is called velocity.
Complete answer:
Here we need to examine the feasibility of all the graphs one by one
Graph a:
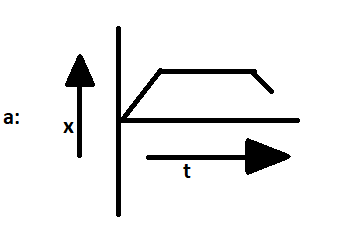
Here we can see that starting from origin both displacement and time were zero then for some time displacement increased with time. After some time the flat line parallel to the x time axis shows that the object has stopped moving and then again after some time the line with declining slope tells us that the object is again moving towards the initial position. The value of displacement is decreasing while the value of time is increasing this has just one meaning that the object has moved towards its original position.
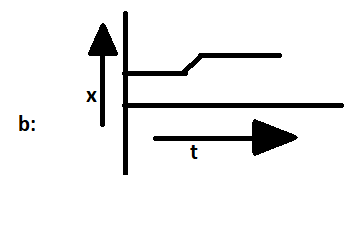
This graph depicts the situation when an object has already had some displacement and then we are tracing its motion so the first flat line parallel to the time axis shows that the object is not moving but as we are tracing its motion so time calculation has started so we see that the object is idle but time is being noted for that period also now suddenly object started moving so we see an increasing slope line then again after some time object stops but time is still being noted.
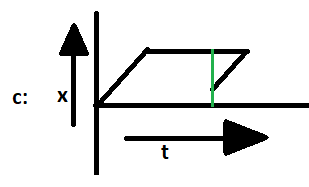
In this graph, we can see that starting from origin both displacement and time were zero then for a while displacement increased with time. After some time the flat line parallel to the x time axis shows that the object has stopped moving and then again after some time the line with declining slope tells us that the object is again moving towards the initial position. But here we can see that in the last stage the line is showing the decrease in time with the change in displacement. In a simple word when an object is moving back towards its initial position it is consuming negative time. And as we know time can never be negative thus this is not a feasible graph, moreover, the green line shows two positions of the same object at the same time which is also not possible
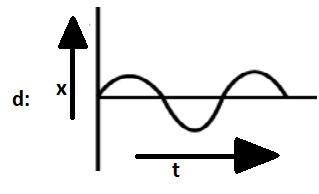
Here the graph depicts the sinusoidal movement of the particle or movement of a particle in a wave. This is a graphical depiction of the motion of the wave.
Final answer is, graph (C) is not possible as it is showing a negative time slope which is not possible or Position-time graph, represent the position of any particle any time t, A particle never acquires more than one position at any particular time.
Note: Time can never be negative so no graph can show negative timing. Displacement can be negative so its graph can show negative movement like if a particle is moving and has a displacement of 50 meters then it is coming back to initial position at have away pointed back its displacement will be 25 meters thus graph can show negative movement.
Complete answer:
Here we need to examine the feasibility of all the graphs one by one
Graph a:
Here we can see that starting from origin both displacement and time were zero then for some time displacement increased with time. After some time the flat line parallel to the x time axis shows that the object has stopped moving and then again after some time the line with declining slope tells us that the object is again moving towards the initial position. The value of displacement is decreasing while the value of time is increasing this has just one meaning that the object has moved towards its original position.
This graph depicts the situation when an object has already had some displacement and then we are tracing its motion so the first flat line parallel to the time axis shows that the object is not moving but as we are tracing its motion so time calculation has started so we see that the object is idle but time is being noted for that period also now suddenly object started moving so we see an increasing slope line then again after some time object stops but time is still being noted.
In this graph, we can see that starting from origin both displacement and time were zero then for a while displacement increased with time. After some time the flat line parallel to the x time axis shows that the object has stopped moving and then again after some time the line with declining slope tells us that the object is again moving towards the initial position. But here we can see that in the last stage the line is showing the decrease in time with the change in displacement. In a simple word when an object is moving back towards its initial position it is consuming negative time. And as we know time can never be negative thus this is not a feasible graph, moreover, the green line shows two positions of the same object at the same time which is also not possible
Here the graph depicts the sinusoidal movement of the particle or movement of a particle in a wave. This is a graphical depiction of the motion of the wave.
Final answer is, graph (C) is not possible as it is showing a negative time slope which is not possible or Position-time graph, represent the position of any particle any time t, A particle never acquires more than one position at any particular time.
Note: Time can never be negative so no graph can show negative timing. Displacement can be negative so its graph can show negative movement like if a particle is moving and has a displacement of 50 meters then it is coming back to initial position at have away pointed back its displacement will be 25 meters thus graph can show negative movement.
Recently Updated Pages
JEE Main 2023 April 6 Shift 1 Question Paper with Answer Key
JEE Main 2023 April 6 Shift 2 Question Paper with Answer Key
JEE Main 2023 (January 31 Evening Shift) Question Paper with Solutions [PDF]
JEE Main 2023 January 30 Shift 2 Question Paper with Answer Key
JEE Main 2023 January 25 Shift 1 Question Paper with Answer Key
JEE Main 2023 January 24 Shift 2 Question Paper with Answer Key
Trending doubts
JEE Main 2026: Session 2 Registration Open, City Intimation Slip, Exam Dates, Syllabus & Eligibility
JEE Main 2026 Application Login: Direct Link, Registration, Form Fill, and Steps
Understanding the Angle of Deviation in a Prism
Hybridisation in Chemistry – Concept, Types & Applications
How to Convert a Galvanometer into an Ammeter or Voltmeter
Understanding Uniform Acceleration in Physics
Other Pages
JEE Advanced Marks vs Ranks 2025: Understanding Category-wise Qualifying Marks and Previous Year Cut-offs
Laws of Motion Class 11 Physics Chapter 4 CBSE Notes - 2025-26
Waves Class 11 Physics Chapter 14 CBSE Notes - 2025-26
Mechanical Properties of Fluids Class 11 Physics Chapter 9 CBSE Notes - 2025-26
Thermodynamics Class 11 Physics Chapter 11 CBSE Notes - 2025-26
Units And Measurements Class 11 Physics Chapter 1 CBSE Notes - 2025-26