


Which part of the distance-time graph represents increasing speed?
A) \[0 - 20\]
B) \[40 - 60\]
C) \[60 - 80\]
D) \[80 - 100\]
Answer
233.1k+ views
Hint: Velocity/ Speed increase with the increase in the distance covered by the time.In a line graph representing the time and distance, the distance may increase or decrease as per the time, but the vertical slanting line shows an increase in speed.
Complete step by step solution: We know velocity defines the distance travelled with time. The speed is defined as the time rate of change of the distance. If there is an increase in speed the distance travelled in the time interval will also be increased. And if the speed decreased, the distance covered in the time interval will also be decreased.
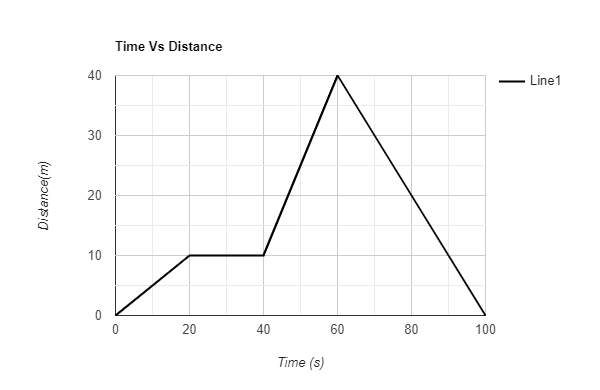
Now, let’s discuss the Time vs. Distance line graph given here.
While considering the first time interval (\[0 - 20\]), there is a vertical slanting line which indicates increasing speed.
While considering the second time interval ($20 - 40$) the distance covered is found to be constant and thus there is neither a rise nor a decrease in the speed occurred.
While considering the third time interval (\[40 - 60\]) there shows a vertical slanting line which indicates increasing speed with a greater slope indicates more speed.
While considering the fourth Time interval (\[60 - 80\]), the distance covered is decreasing and the slope indicates the decreased speed.
While considering the last Time interval (\[80 - 100\]), the distance covered is decreasing and the slope indicating the decreased speed is the same as the fourth time interval.
By analysing all these cases the increased speed is represented by the time interval \[40 - 60\] in the Time vs. Distance line graph.
Final answer is: Option (B).
Note: If there is a change in the velocity, there will be a difference in the distance travelled in a time interval, Thus in a time- Distance line graph, There will be difference in the slope of the line.
Speed is calculated by \[s = \dfrac{d}{t}\]
Where, \[s - speed\]
\[d - distance\]
\[t - time\]
Complete step by step solution: We know velocity defines the distance travelled with time. The speed is defined as the time rate of change of the distance. If there is an increase in speed the distance travelled in the time interval will also be increased. And if the speed decreased, the distance covered in the time interval will also be decreased.
Now, let’s discuss the Time vs. Distance line graph given here.
While considering the first time interval (\[0 - 20\]), there is a vertical slanting line which indicates increasing speed.
While considering the second time interval ($20 - 40$) the distance covered is found to be constant and thus there is neither a rise nor a decrease in the speed occurred.
While considering the third time interval (\[40 - 60\]) there shows a vertical slanting line which indicates increasing speed with a greater slope indicates more speed.
While considering the fourth Time interval (\[60 - 80\]), the distance covered is decreasing and the slope indicates the decreased speed.
While considering the last Time interval (\[80 - 100\]), the distance covered is decreasing and the slope indicating the decreased speed is the same as the fourth time interval.
By analysing all these cases the increased speed is represented by the time interval \[40 - 60\] in the Time vs. Distance line graph.
Final answer is: Option (B).
Note: If there is a change in the velocity, there will be a difference in the distance travelled in a time interval, Thus in a time- Distance line graph, There will be difference in the slope of the line.
Speed is calculated by \[s = \dfrac{d}{t}\]
Where, \[s - speed\]
\[d - distance\]
\[t - time\]
Recently Updated Pages
JEE Main 2023 April 6 Shift 1 Question Paper with Answer Key
JEE Main 2023 April 6 Shift 2 Question Paper with Answer Key
JEE Main 2023 (January 31 Evening Shift) Question Paper with Solutions [PDF]
JEE Main 2023 January 30 Shift 2 Question Paper with Answer Key
JEE Main 2023 January 25 Shift 1 Question Paper with Answer Key
JEE Main 2023 January 24 Shift 2 Question Paper with Answer Key
Trending doubts
JEE Main 2026: Session 2 Registration Open, City Intimation Slip, Exam Dates, Syllabus & Eligibility
JEE Main 2026 Application Login: Direct Link, Registration, Form Fill, and Steps
JEE Main Marking Scheme 2026- Paper-Wise Marks Distribution and Negative Marking Details
Understanding the Angle of Deviation in a Prism
Hybridisation in Chemistry – Concept, Types & Applications
How to Convert a Galvanometer into an Ammeter or Voltmeter
Other Pages
JEE Advanced Marks vs Ranks 2025: Understanding Category-wise Qualifying Marks and Previous Year Cut-offs
Laws of Motion Class 11 Physics Chapter 4 CBSE Notes - 2025-26
Waves Class 11 Physics Chapter 14 CBSE Notes - 2025-26
Mechanical Properties of Fluids Class 11 Physics Chapter 9 CBSE Notes - 2025-26
Thermodynamics Class 11 Physics Chapter 11 CBSE Notes - 2025-26
Units And Measurements Class 11 Physics Chapter 1 CBSE Notes - 2025-26