Courses
Courses for Kids
Free study material
Offline Centres
More
Store Icon
Store

NCERT Solutions for Class 12 Micro Economics Chapter 2 Theory of Consumer Behaviour

ffImage
banner
widget title icon
Latest Updates

widget icon
Start Your Preparation Now :
CBSE Date Sheet 2025 Class 12 Released

Class 12 NCERT Solutions Micro Economics - Theory of Consumer Behaviour - Free PDF Download

Class 12 Economics Chapter 2 Microeconomics NCERT Solutions is the best platform out there for the students to reach out for their throughout and last-minute preparations. NCERT Solutions for Class 12 Microeconomics Chapter 2 gives the learners an insight into the behaviour of consumers, utility, budget, demands, and the theorems and laws associated with it. The approach taken by our subject experts ensures the students to infer the subject from a practical point of view along with cultivating integrity in their answer presentation. Thus, students can be certain about scoring the best in this subject.


Class:

NCERT Solutions for Class 12

Subject:

Class 12 Economics

Subject Part:

Economics Part 1 - Micro Economics

Chapter Name:

Chapter 2 - Theory Of Consumer Behaviour

Content-Type:

Text, Videos, Images and PDF Format

Academic Year:

2024-25

Medium:

English and Hindi

Available Materials:

  • Chapter Wise

  • Exercise Wise

Other Materials

  • Important Questions

  • Revision Notes

Access NCERT Solutions for Class 12 Micro Economics Chapter - 2 Theory Of Consumer Behaviour

1. What do you mean by the budget of a consumer?

Ans: A consumer's budget is the actual purchasing power with which he or she can buy a set of two commodities, given their prices.


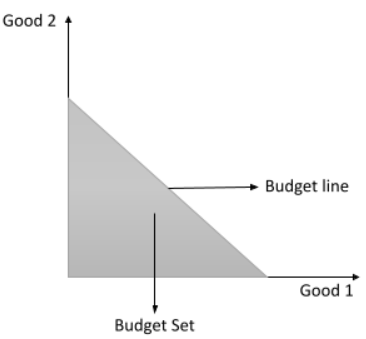
Budget Line and Budget Set

The quantity of Good 1 is measured horizontally, whereas the quantity of Good 2 is measured vertically. Any point that is above or below the straight line, i.e., the budget line, make up the budget set.


2. What is the budget line?

Ans: The budget line depicts all of the bundles that cost the same as the consumer's income. The budget line shows two alternative sets of products that a person can purchase dependent on his or her income and commodities costs.

Let ${\mathrm x}_1$ be the amount of Good 1.

${\mathrm x}_2$ is the amount of Good 2.

While,

${\mathrm p}_1$ be the price of Good 1, and

${\mathrm p}_2$ be the price of Good 2.

${\mathrm p}_1{\mathrm x}_1$ = Total money spent on Good 1.

${\mathrm p}_2{\mathrm x}_2$ = Total money spent on Good 2.

Then, the budget line will be:

${\mathrm p}_1{\mathrm x}_1+{\mathrm p}_2{\mathrm x}_2=\mathrm M$

The consumer pays exactly the same amount for all of the consumption bundles on the budget line.


3. Explain why the budget line is downward sloping?

Ans: The budget line is sloped downward because a consumer may only increase consumption of product 1 by decreasing consumption of Good 2. The consumer has a restricted budget to spend on Goods 1 and 2. 

The budget line's slope is, which denotes the rate of exchange or the rate at $\dfrac{-{\mathrm P}_1}{{\mathrm P}_2}=\dfrac{\triangle{\mathrm x}_2}{\triangle{\mathrm x}_1}$ at which Good 2 can be swapped for Good 1.


4. A consumer wants to consume two goods. The prices of the two goods are Rs 4 and Rs 5 respectively. The consumer’s income is Rs 20.

(i) Write down the equation of the budget line.

Ans: Let ${\mathrm x}_1$ denote Good 1 and

${\mathrm x}_2$ denotes Good 2.

${\mathrm P}_1=\mathrm{Rs}\;4,\;{\mathrm P}_2=\mathrm{Rs}\;5,\;\mathrm M\;=\;\mathrm{Rs}\;20$

${\mathrm P}_1{\mathrm x}_1+{\mathrm P}_2{\mathrm x}_2=\mathrm M$

$4{\mathrm x}_1+5{\mathrm x}_2=20$

Thus, the equation of the budget line is $4{\mathrm x}_1+5{\mathrm x}_2=20.$

(ii) How much of good 1 can the consumer consume if she spends her entire income on that good?

Ans:  If Rs 20 is spent totally on good 1, the amount needed for Good 2 would be zero, i.e. $x_2 = 0$,  because the consumer has no money left to spend on Good 2.

$4{\mathrm x}_1+5\left(0\right)=20\\4{\mathrm x}_1=20\\{\mathrm x}_1=\dfrac{20}4\\{\mathrm x}_1=5$

So, the amount of Good 1 consumed is 5 units.

(iii) How much of good 2 can she consume if she spends her entire income on that good?

Ans: If the consumer spends all of his or her money on Good 2, the result is $x_1 = 0$, because the consumer has no money left to spend on Good 1.

$4\left(0\right)+5{\mathrm x}_2=20\\5{\mathrm x}_2=20\\{\mathrm x}_2=\dfrac{20}5\\{\mathrm x}_2=4$

The amount of Good 2 consumed is 4 units.

(iv) What is the slope of the budget line?

Ans: Slope of the budget line = $\dfrac{-{\mathrm P}_1}{{\mathrm P}_2}$

$=\dfrac{-\mathrm{Price}\;\mathrm{of}\;\mathrm{Good}\;1}{\mathrm{Price\;of}\;\mathrm{Good}\;2}=-\dfrac45\\=-0.8$


Questions 5, 6 and 7 are related to question 4.

5. How does the budget line change if the consumer’s income increases to Rs 40 but the prices remain unchanged?

Ans: ${\mathrm M}_2=\mathrm{Rs}.\;40$

${\mathrm P}_1=\mathrm{Rs}.\;4\\{\mathrm P}_2=\mathrm{Rs}.\;5$

Initial equation of the budget line:

$4{\mathrm x}_1+5{\mathrm x}_2=20$

New equation of the budget line:

$4{\mathrm x}_1+5{\mathrm x}_2=40$

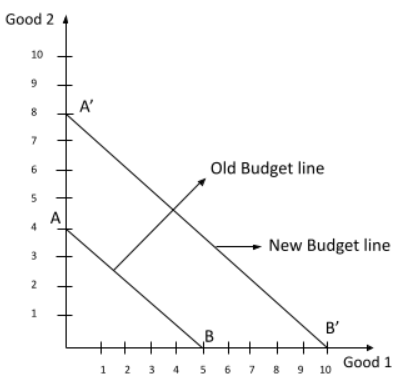
The consumer may now buy more of both commodities and services as M increases, and the rise in income results in a corresponding outward shift of the budget line from AB to A'B'.

Horizontal intercept will be $=\dfrac{\mathrm M}{{\mathrm P}_1}=\dfrac{40}4=10$

Vertical intercept will be $=\dfrac{\mathrm M}{{\mathrm P}_2}=\dfrac{40}5=8$

The new budget line's slope will be similar to the real budget line.

$\dfrac{-{\mathrm P}_1}{{\mathrm P}_2}=\dfrac45$


Old and New Budget Line

6. How does the budget line change if the price of good 2 decreases by a rupee but the price of good 1 and the consumer’s income remain unchanged?

Ans: ${\mathrm P}_1=\mathrm{Rs}.\;4$

${\mathrm P}_2=\mathrm{Rs}.\;5$

$\mathrm P_2^1=\mathrm{Rs}.\;4$

M = Rs. 20

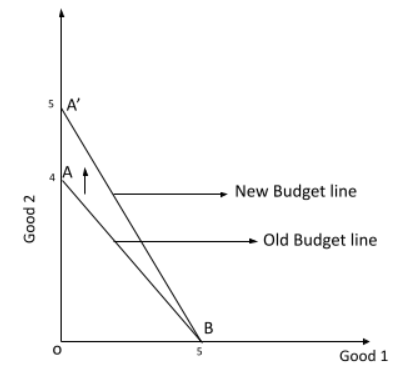
The drop in the price of Good 2 will raise the vertical intercept of the budget line because the income and price of Good 1 stay unchanged. The new budget line will pivot outwards as well, centred on the same horizontal intercept.

Horizontal intercept will be $=\dfrac{\mathrm M}{{\mathrm P}_1}=\dfrac{20}4=5$

Vertical intercept will be $=\dfrac{\mathrm M}{{\mathrm P}_2}=\dfrac{20}4=5$

$Slope =\dfrac{-{\mathrm P}_1}{{\mathrm P}_2}=\dfrac44=1$


Change in the budget line

The slope of the new budget line will be higher, and it will be steeper than the previous one.


7. What happens to the budget set if both the prices as well as the income double?

Ans: The budget line will not change if the prices and income are both doubled.

${\mathrm M}_1=\;\mathrm{Rs}\;20,\;{\mathrm M}_2=\;\mathrm{Rs}\;40\\{\mathrm P}_1=\;\mathrm{Rs}\;4,\;{\mathrm P}_1=\;\mathrm{Rs}\;8\\{\mathrm P}_2=\mathrm{Rs}\;5,\;{\mathrm P}_2=\mathrm{Rs}\;10$

Horizontal intercept will be $=\dfrac{{\mathrm M}_1}{{\mathrm P}_1}=\dfrac{40}8=5$

Vertical intercept will be $=\dfrac{{\mathrm M}_2}{{\mathrm P}_2}=\dfrac{40}{10}=4$

Slope $=\dfrac{-{\mathrm P}_1}{{\mathrm P}_2}=\dfrac{-8}{10}=-0.8$

As a result, the budget line's vertical intercept, horizontal intercept, and slope will remain unchanged. The new budget line will be identical to the existing budget line, but it will be linked to higher income and higher pricing for both commodities.


8. Suppose a consumer can afford to buy 6 units of good 1 and 8 units of good 2 if she spends her entire income. The prices of the two goods are Rs 6 and Rs 8 respectively. How much is the consumer’s income?

Ans:

$ {\mathrm P}_1=\mathrm{Rs}\;6\\{\mathrm P}_2=\mathrm{Rs}\;8\\{\mathrm x}_1=6\\{\mathrm x}_2=8$

Budget line $=\mathrm M={\mathrm P}_1{\mathrm x}_1+{\mathrm P}_2{\mathrm x}_2$

M = 6 x 6 + 8 x 8

M = 36 + 64

M = 100

Thus, the consumer’s income is Rs 100.


9. Suppose a consumer wants to consume two goods which are available only in integer units. The two goods are equally priced at Rs 10 and the consumer’s income is Rs 40.

(i) Write down all the bundles that are available to the consumer.

Ans: 

${\mathrm P}_1=\mathrm{Rs}\;10$

${\mathrm P}_2=\mathrm{Rs}\;10$

M = Rs 40

Budget set $={\mathrm P}_1{\mathrm x}_1+{\mathrm P}_2{\mathrm x}_2\leq\mathrm M$

$10{\mathrm x}_1+10{\mathrm x}_2\leq40$

The consumer should be able to purchase bundles for less than or equivalent to Rs 40.


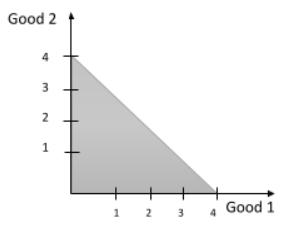
Good 1 and Good 2

Horizontal intercept will be $=\dfrac{{\mathrm M}_1}{{\mathrm P}_1}=\dfrac{40}{10}=4$

Vertical intercept will be $=\dfrac{{\mathrm M}_2}{{\mathrm P}_2}=\dfrac{40}{10}=4$

Slope $=\dfrac{-{\mathrm P}_1}{{\mathrm P}_2}=\dfrac{-10}{10}=-1$

The consumer has access to all of the bundles in the shaded region $\Delta AOB$, including those on the line AB.

(0, 0) (0, 1) (0, 2) (0, 3) (0, 4)

(1, 0) (1, 1) (1, 2) (1, 3) (2, 0)

(2, 1) (2, 2) (3, 0) (3, 1) (4, 0)

(ii) Among the bundles that are available to the consumer, identify those which cost her exactly Rs 40.

Ans: The cost of the coordinates on the line AB is the same as the consumer's income. The following are the bundles:

(0,4) (1,3) (2,2) (3,1) (4,0)


10. What do you mean by ‘monotonic preferences’?

Ans: If and only if, a consumer's preferences are monotonic between any two bundles. The consumer prefers bundles that contain more of at least one good and no less of the other good than the other bundle. More of a commodity is always preferred by a rational customer since it provides him with a higher level of enjoyment.

Example: If a buyer has the option to choose between bundles A(4,6) and B(4,2), he or she will choose bundle A since it contains more units of Good 2 than bundle B.


11. If a consumer has monotonic preferences, can she be indifferent between the bundles (10, 8) and (8, 6)?

Ans: According to monotonic preferences, a customer cannot choose between these two bundles because bundle 1 contains more of both commodities than bundle 2. Bundle 1 is preferred above bundle 2 since it contains 10 units of Good 1 and 8 units of Good 2, whereas bundle 2 contains 8 units and 6 units of Good 1 and Good 2, respectively.


12. Suppose a consumer’s preferences are monotonic. What can you say about her preference ranking over the bundles (10, 10), (10, 9) and (9, 9)?

Ans: If a customer has monotone preferences, they will be ranked in the following order:

(10,10) as the first preference

(10,9) as the second preference, and

(9,9) as the third preference. 


13. Suppose your friend is indifferent to the bundles (5, 6) and (6, 6). Are the preferences of your friend monotonic?

Ans: Given that my friend has differing viewpoints on the bundles (5,6), (6,6). This indicates that his or her tastes are not consistent. If he or she is unconcerned about both bundles, it signifies that they provide the same level of satisfaction and are ranked similarly. On the other hand, the second bundle has more of both goods. As a result, he/she must favour the second bundle above the first, based on the monotonic assumption.


14. Suppose there are two consumers in the market for a good and their demand functions are as follows:

d1(p) = 20 – p for any price less than or equal to 20, and d1(p) = 0 at any price greater than 20.

d2(p) = 30 – 2p for any price less than or equal to 15 and d1(p) = 0 at any price greater than 15.

Find out the market demand function.

Ans: ${\mathrm d}_1\left(\mathrm p\right)=20-\mathrm p\left\{\mathrm p\leq20\;\mathrm p>20\right.$

${\mathrm d}_2\left(\mathrm p\right)=30-2\mathrm p\left\{\mathrm p\leq15\;\mathrm p>15\right.$

For the price less than Rs. 15 $\left(\mathrm p\leq15\right)$

Market demand for a good $={\mathrm d}_1\left(\mathrm p\right)+{\mathrm d}_2\left(\mathrm p\right)$

$=20-\mathrm p+30-2\mathrm p\\=50-3\mathrm p$

For price more than Rs. 15 but less than Rs 20 $\left(15<\mathrm p\leq20\right)$

Market demand $={\mathrm d}_1\left(\mathrm p\right)+{\mathrm d}_2\left(\mathrm p\right)$

$=20-\mathrm p+0\;\left(\because\mathrm{for}\;\mathrm p>15,\;{\mathrm d}_2\left(\mathrm p\right)=0\right)\\=20-\mathrm p$

For price more than 20 $\left(\mathrm p>20\right)$

Market demand $={\mathrm d}_1\left(\mathrm p\right)+{\mathrm d}_2\left(\mathrm p\right)$

$=0+0\;\left(\because\mathrm{for}\;\mathrm p>10,{\mathrm d}_1\left(\mathrm p\right)=0,\;{\mathrm d}_2\left(\mathrm p\right)=0\right)\\=0$

Thus, the market demand

$=50-3\mathrm p,\;\mathrm{if}\;\mathrm p\leq15\\=20-\mathrm p,\;\mathrm{if}\;15<\mathrm p\leq20\\=0\;\mathrm{if}\;\mathrm p>20$


15. Suppose there are 20 consumers for a good and they have identical demand functions: 

$d(p) = 10 – 3p$ for any price less than or equal to $\dfrac{10}{3\;}$ and ${\mathrm d}_1\left(\mathrm p\right)=0$ at any price greater than $\dfrac{10}{3\;}.$

Ans: $\mathrm d\left(\mathrm p\right)=10-3\mathrm p,\;\mathrm{if}\;\mathrm p\leq\dfrac{10}3$

${\mathrm d}_1\left(\mathrm p\right)=0\;\mathrm{if}\;\mathrm p>\dfrac{10}{3}$

Market demand is the total of all of the market's customers' demands.

For price $\leq\dfrac{10}{3}$

Market demand $= 20\sum\mathrm d\left(\mathrm p\right) \text{[Since consumers have similar demand curve]}$

$=20\times\left(10-3\mathrm p\right)\\=200-6\mathrm p$

For price >$\dfrac{10}{3}$

Market demand = $20\times{\mathrm d}_1\left(\mathrm p\right)$

= 20 x 0

= 0

Market demand function =  $200-6\mathrm p\left\{\begin{array}{l}\mathrm{if}\;\mathrm p\leq\dfrac{10}3\\\mathrm{if}\;\mathrm p>\dfrac{10}3\end{array}\right.$

= 0


16. Consider a market where there are just two consumers and suppose their demands for the good are given as follows:

Calculate the market demand for the good.

p

d1

d2

1

9

24

2

8

20

3

7

18

4

6

16

5

5

14

6

4

12


Ans:

p

d1

d2

Market Demand (D) = (d1 + d2)

Total

1

9

24

9 + 24 

33

2

8

20

8 + 20

28

3

7

18

7 + 18

25

4

6

16

6 + 16

22

5

5

14

5 + 14

19

6

4

12

4 + 12

16


17. What do you mean by a normal good?

Ans: The demand for a normal good grows in proportion to an increase in the consumer's income or wage.  


18. What do you mean by an ‘inferior good’? Give some examples.

Ans: When a consumer's income rises, demand for inferior goods decreases. As a result, the demand for lower-quality goods rises in tandem with consumer affordability.

Example: When the price of a good $\left({\mathrm P}_{\mathrm x}\right)$ rises, so does the demand for the good $\left({\mathrm D}_{\mathrm x}\right)$. The desire for inferior goods falls as the consumer's income rises. Foods such as coarse grains are an example.


19. What do you mean by substitutes? Give examples of two goods which are substitutes of each other.

Ans: Substitute goods are products that can be used in place of other products.

Tea and coffee, for example, are items that can be swapped for one another. If the price of tea rises, demand for tea will fall, and consumers would replace coffee for tea, resulting in an increase in coffee demand.

If there is an increase in the price of tea $\left({\mathrm P}_{\mathrm T}\right)$, then the demand for tea decreases $\left({\mathrm D}_{\mathrm T}\right)$ and the demand for coffee increases $\left({\mathrm D}_{\mathrm C}\right)$.


20. What do you mean by complements? Give examples of two goods which are complements of each other.

Ans: Complementary goods are those that are consumed together. 

Tea and sugar, for example. If the price of sugar rises, the demand for tea will decline. The demand for sugar will be reduced if the price of tea rises.

If there is an increase in the price of tea $\left({\mathrm P}_{\mathrm T}\right)$, then the demand for sugar decreases $\left({\mathrm D}_{\mathrm S}\right)$.

If there is an increase in the price of sugar $\left({\mathrm P}_{\mathrm S}\right)$, then the demand for tea decreases $\left({\mathrm D}_{\mathrm T}\right)$.


21. Explain price elasticity of demand.

Ans: The price elasticity of demand is a measurement of how a change in price influences consumer demand for a product. It's computed by dividing the change in a product's needed quantity by the change in the product's cost.

${\mathrm e}_{\mathrm d}=\dfrac{\mathrm{percentage}\;\mathrm{change}\;\mathrm{in}\;\mathrm{demand}\;\mathrm{for}\;\mathrm{the}\;\mathrm{good}}{\mathrm{percentage}\;\mathrm{change}\;\mathrm{in}\;\mathrm{the}\;\mathrm{price}\;\mathrm{of}\;\mathrm{the}\;\mathrm{good}}\\{\mathrm e}_{\mathrm d}=\dfrac{\triangle\mathrm Q}{\triangle\mathrm P}\times\dfrac{\mathrm P}{\mathrm Q}$

Where ${\mathrm e}_{\mathrm d}$= Elasticity of demand

$\triangle\mathrm Q$ = Change in quantity

$\triangle\mathrm P$ = Change in price

P = Initial price

Q = Initial Quantity


22. Consider the demand for a good. At price Rs 4, the demand for the good is 25 units. Suppose the price of the good increases to Rs 5, and as a result, the demand for the good falls to 20 units. Calculate the price elasticity.

Ans: ${\mathrm P}_1=4,\;{\mathrm Q}_1=25$

${\mathrm P}_2=5,\;{\mathrm Q}_2=20$

$\triangle\mathrm P={\mathrm P}_2-{\mathrm P}_1=5-4=1\\\triangle\mathrm Q={\mathrm Q}_2-{\mathrm Q}_1=20-25=-5\\{\mathrm e}_{\mathrm d}=\dfrac{\triangle\mathrm Q}{\triangle\mathrm P}\times\dfrac{\mathrm P}{\mathrm Q}\\=\dfrac{-5}1\times\dfrac4{25}\\=\dfrac{-4}5\\{\mathrm e}_{\mathrm d}=-0.8$


23. Consider the demand curve D (p) = 10 – 3p. What is the elasticity at price $\dfrac{5}{3}?$

Ans: D(p) = 10 – 3p

$\mathrm b=\dfrac{\triangle\mathrm D}{\triangle\mathrm p}=3\\\mathrm p=\dfrac{5}{3}$ or

$\mathrm D\left(\mathrm p\right)=10-3\times\dfrac53\\=10-5\\=5$

D = 5 units

${\mathrm e}_{\mathrm d}=\dfrac{\triangle\mathrm Q}{\triangle\mathrm P}\times\dfrac{\mathrm P}{\mathrm Q}\\{\mathrm e}_{\mathrm d}=\left(-\right)\dfrac53\times\dfrac15-3\\{\mathrm e}_{\mathrm d}=1$

Therefore, the elasticity of demand is 1.


24. Suppose the price elasticity of demand for a good is – 0.2. If there is a 5 % increase in the price of the good, by what percentage will the demand for the good go down?

Ans: Note that ${\mathrm e}_{\mathrm d}$= -0.2 

Hence, we need not prefix ${\mathrm e}_{\mathrm d}$ to -2.

Percentage change in price = 5%

${\mathrm e}_{\mathrm d}=\dfrac{\mathrm{percentage}\;\mathrm{change}\;\mathrm{in}\;\mathrm{demand}\;\mathrm{for}\;\mathrm{the}\;\mathrm{good}}{\mathrm{percentage}\;\mathrm{change}\;\mathrm{in}\;\mathrm{the}\;\mathrm{price}\;\mathrm{of}\;\mathrm{the}\;\mathrm{good}}\\-0.2=\dfrac{\mathrm{percentage}\;\mathrm{change}\;\mathrm{in}\;\mathrm{demand}\;\mathrm{for}\;\mathrm{the}\;\mathrm{good}}5$

Percentage change in quantity demanded = -1%.

Thus, there is a decrease in demand.


25. Suppose the price elasticity of demand for a good is – 0.2. How will the expenditure on the good be affected if there is a 10 % increase in the price of the good?

Ans: As the price elasticity of demand, ${\mathrm e}_{\mathrm p}$, is smaller than one in elastic demand, a rise in the price of the good will result in an increase in expenditure. Because price and expenditure are positively connected in the case of inelastic demand.


26. Suppose there was a 4 % decrease in the price of a good, and as a result, the expenditure on the good increased by 2 %. What can you say about the elasticity of demand?

Ans: Decrease in the price of a good = 4%

Increase of expenditure on the good = 2%

$\triangle\mathrm E=\triangle\mathrm P\;\left[\mathrm q+\left(1+{\mathrm e}_{\mathrm d}\right)\right]$

Since the price has dropped, the amount spent on the item will rise. This means that the percent change in demand has climbed more than the percent change in pricing has decreased.

The price of the good and the amount spent on it have an inverse relationship.

Thus, the elasticity of demand = $\dfrac{\%\;\mathrm{change}\;\mathrm{in}\;\mathrm{demand}}{\%\;\mathrm{change}\;\mathrm{in}\;\mathrm{price}}$

The numerator is greater than the denominator. This indicates that elasticity is greater than one. As a result, a little change in price has resulted in a larger change in demand, indicating that demand is elastic.


Ncert Solutions Class 12 Microeconomics Chapter 2 - Free PDF Download

The study materials of Microeconomics Class 12 Chapter 2 NCERT Solutions can be owned free of cost from the link provided below. With this, students will be capable of tackling all sorts of questions coming from this chapter. Class 12 Microeconomics Chapter 2 NCERT Solutions contributes to the building of a strong foundation of economics for the students. 


The quality solutions, numerical, graphs, etc allows the pupils to explore the subject more. Frequent revision of these notes assures a strong attraction towards the subjects in students. Free study material makes it easier for students to learn the concepts instead of wasting time searching for other notes.


NCERT Solutions Class 12 Microeconomics 

Chapter 2 - Theory of Consumer Behaviour 

CBSE Class 12 Microeconomics Chapter 2 Solutions orbits around very crucial aspects of economics a student needs to get a hold of. Many of the times, these topics may seem confusing to beginners. And this is when NCERT Solutions can be relied on to make the learning process simpler and understandable. Without a doubt, the study materials provided here can make a student capable of knowing the subject in depth. Topics like consumer behaviour, marginal utility, budget line, consumer's equilibrium, market demand, etc are explained in a way that enables the students to visualize the concepts.


NCERT Solutions Class 12 Microeconomics Chapter Wise Marks Weightage

Theory of Consumer Behaviour is one of the easiest to learn and score portion of economics. By using the study materials of NCERT Solutions for Chapter 2 Microeconomics of Class 12, students will never miss out on any questions from this part. The revision questions and other activities in the material covers all the repeatedly asking short and long answer questions in the examination.


Along with this, extra questions and other concepts are also factually explained in the material. This guarantees covering all the parts of the chapter. A quick review of the whole chapter is possible with NCERT Solutions. Even the slightest doubt of a student can be cleared using NCERT Solutions. All the solutions are organized systematically.


Why are NCERT Solutions for Class 12th Microeconomics Chapter 2  Important?

  • Our best experts help out the students to understand the subject from a broader point of view.

  • With all possible sources of learning, students are good to go for any examinations regarding this subject.

  • These notes are constructed in a way that the students can always rely on it for quick revisions as well as long term study.

  • The graphs and tabular columns provided makes the learning process thorough and easy to memorize.

  • The best part of NCERT Solutions is that it not only trains the students for school examinations but also for all kinds of competitive examinations too.


Important Study Material Links for Class 12 Economics Chapter 2 - Theory of Consumer Behaviour

S.No.

Important Study Materials Links for Class 12 Economics Chapter 2

1.

Class 12 Theory of Consumer Behaviour Revision Notes

2.

Class 12 Theory of Consumer Behaviour Important Questions


NCERT Solutions for Class 12 Macro Economics - Chapter-wise List

Given below are the chapter-wise NCERT Solutions for Class 12 Macro Economics. These solutions are provided by the Macro Economics experts at Vedantu in a detailed manner. Go through these chapter-wise solutions to be thoroughly familiar with the concepts.


NCERT Solutions for Class 12 Micro Economics - Chapter-wise List

Given below are the chapter-wise NCERT Solutions for Class 12 Micro Economics. These solutions are provided by the Micro Economics experts at Vedantu in a detailed manner. Go through these chapter-wise solutions to be thoroughly familiar with the concepts.


Additional NCERT Books for Class 12 Economics

The NCERT Books for Class 12 Economics provide a comprehensive understanding of key economic theories and concepts. These textbooks are essential resources for students preparing for their board exams, covering both microeconomics and macroeconomics in detail.


Related Links for NCERT Solutions Class 12 Economics

These links offer direct access to detailed NCERT Solutions for Class 12 Economics. Covering both microeconomics and macroeconomics, these solutions help students understand key concepts and prepare effectively for exams.


Important Related Links for CBSE Class 12 Economics

FAQs on NCERT Solutions for Class 12 Micro Economics Chapter 2 Theory of Consumer Behaviour

1. What is Meant by the Term Normal Good? Explain Along with Examples.

Ans: Normal goods can be referred to as a product or material that experiences an increase in its demand due to the increase in the consumer's income. 


If explained graphically, the demand curve for a normal good tends to shift out when the consumer's income increases. 


For example, vegetables come under normal goods. When the consumer's income rises, naturally the demand for the good also increases. The same is the case with other normal goods like fruits, clothing, electronic appliances, etc.

2. What are Complements? Give Examples of Goods that Complement Each Other.

Ans: Complements can be explained simply as the goods which complement each other or in other words which are consumed together. These can be referred to as the products which can be used only if another product is used along with it. 


Examples for complements are petrol and car, ink and fountain pen, sugar and tea, etc.


Thus, it is understood that a fountain pen can't be used without ink, which makes them complements. This stands true for all other examples.

3. What is utility? Explain its types.

Ans: Utility refers to the term in microeconomics that has been given to the capacity held by a commodity to satisfy human wants and needs. Utility is further classified into the following types:

  • Total Utility: This refers to the total amount of satisfaction achieved from a particular commodity or service.

  • Marginal Utility: This refers to the change in total utility that is a result of consuming an additional unit of the commodity.

4. What does a consumer budget mean?

Ans: While a budget presents us with all combinations of services and goods that an individual may purchase within their income and according to the existing prices, the consumer budget on the other hand presents the existent purchasing capacity of a consumer with which they can purchase a total of two goods depending on the prices. Students can find more details on this available in the study material for Chapter 2 of Class 12 Microeconomics.

5. What is a budget line?

Ans: As discussed in Chapter 2 in Class 12 Microeconomics, the budget line refers to a graphical representation of all the bundles of two commodities based on the consumer’s income and the existing prices that cost the amount which is equal to a consumer’s earnings. The equation to represent a budget line is P1.X1 + P2.X2 = M. More on representing a budget line on a graph can be found in NCERT Solutions for Class 12 Micro Economics - Chapter 2 - Theory of Consumer Behaviour.

6. What are the topics covered in Chapter 2 of Class 12 Micro Economics?

Ans: Class 12 Micro Economics - Chapter 2 - Theory of Consumer Behaviour covers the following topics:

  • Utility and its types

  • Consumer’s Bundle

  • Consumer Budget

  • Budget Set

  • Equation and graphical representation of budget line

  • Change in budget line

  • Consumer’s Equilibrium

  • Marginal Rate of Substitution

  • Examples and properties of a budget line

  • Requirements of a budget line

  • Market Demand

  • Laws and changes in demand

  • Total Expenditure method and its geometrical method

7. How are NCERT Solutions for Chapter 2 of Class 12 Micro Economics helpful for students?

Ans: NCERT Solutions for Chapter 2 of Class 12 Microeconomics is meant to help students by providing study material that they can use to increase their understanding of the concepts taught in this chapter. These solutions provide students accurate and well-explained information that they can learn and be able to score well in their Class 12 Economics exams. These NCERT Solutions are also available in both English and Hindi mediums. These solutions are prepared by best Economics teachers in India and are based on the latest guidelines by CBSE. These solutions are available at free of cost on Vedantu website(vedantu.com) and mobile app as well.