Courses
Courses for Kids
Free study material
Offline Centres
More
Store Icon
Store

NCERT Solutions for Class 7 Maths Chapter 3 Data Handling

ffImage
banner

NCERT Maths Chapter 3 Data Handling Class 7 Solutions - FREE PDF Download

Class 7 Maths NCERT Solutions for Chapter 3 Data Handling introduces students to data collection, organization, and interpretation. This chapter is fundamental in helping students understand how to manage data effectively and derive meaningful conclusions from it. Data will be presented in tables and frequency distribution tables to identify patterns and trends. Understanding measures like mean, median, and mode to find a representative value of a dataset.

toc-symbolTable of Content
toggle-arrow


Students will learn these concepts and solve the problems given in the exercise to build their concepts well. To make this process easier, download and refer to the latest CBSE Class 7 Maths Syllabus prepared by the experts.


Glance on Maths Chapter 3 Data Handling Class 7 Solutions

  • The data is a collection of information. 

  • The collection, representation, and presentation of data help to organize information.

  • Data can be collected and organized in the form of a table.

  • The sum of observations to the total number of observations is known as the Arithmetic Mean.

  • The mid-value of the observation is known as the Median.

  • The data that occurs many times in a set is known as Mode. 

  • Graphs and charts help to represent and compare data in pictorial form.

  • This article contains chapter notes, important questions, exemplar solutions, exercises, and video links for Chapter 3 - Data Handling, which you can download as PDFs.

  • There are three exercises (20 fully solved questions) in class 7th maths chapter 3 Data Handling.


Access Exercise Wise NCERT Solutions for Chapter 3 Maths Class 7


Exercises Under NCERT Solutions for Class 7 Maths Chapter 3 Data Handling

  • Exercise 3.1: This exercise focuses on an introduction to Data Handling like understanding the concept of data, collecting and recording data, organizing data into a frequency distribution table, and interpreting data from tables.

  • Exercise 3.2: This exercise focuses on Mean, Median, and Mode calculation of the mean (average) of a set of numbers, finding the median (middle value) of a set of numbers, and identifying the mode (most frequent value) of a set of numbers.

  • Exercise 3.3: This exercise focuses on graphical Representation of Data like constructing and interpreting bar graphs, understanding double bar graphs for comparing two sets of data, and creating and reading pie charts to represent data as parts of a whole.


Access NCERT Solutions for Class 7 Maths Chapter 3 –  Data Handling

Exercise 3.1

1. Find the range of heights of any ten students in your class.

Ans:

S. No.

Name of Students

Height (in feet)

1.

Gunjan

4.2 

2.

Aditi

4.5

3.

Nikhil

4.

Akhil

5.1

5.

Ria

5.2

6.

Akshat

5.3

7.

Abhishek

5.1

8.

Mayank

4.7

9.

Rahul

4.9

10.

Ayush

4.5


We will find the range of heights by getting the difference between the highest height and lowest height.

Range= Highest height – Lowest Height

 $ =5.3-4.2\dfrac{z}{3} $ 

$ =1.1 $ 

Hence, the range of height of ten students of the class is 1.1 feet.


2. Organize the following marks in a class assessment, in a tabular form: 4, 6, 7, 5, 3, 5, 4, 5, 2, 6, 2, 5, 1, 9, 6, 5, 8, 4, 6, 7.

(i) Which number is highest?

(ii) Which number is lowest?

(iii) What is the range of the lowest?

(iv) Find the arithmetic mean

Ans: 

Marks

Tally Marks

Frequency

1

|

1

2

||

2

3

|

1

4

|||

3

5

||||

5

6

||||

4

7

||

2

8

|

1

9

|

1


1. The highest number among the given data is 9.

2. The lowest number among the given data is 1.

3. We will find the range of marks by getting the difference between the highest value and lowest value.

Range= Highest value – Lowest value

$ =9-1 \\ $

$ =8 \\ $

Hence, the range of marks is 8.


4. We know that, arithmetic mean is the sum of all observations divided by the total number of observations.

$ \text{Mean=}\dfrac{\text{Sum of all observations}}{\text{Number of observations}} \\ $

$ \text{=}\dfrac{4+6+7+5+3+5+4+5+2+6+2+5+1+9+6+5+8+4+6+7}{20} \\ $

$ \text{=}\dfrac{100}{20} \\ $

$ \text{=5} \\ $


3.Find the mean of the first five whole numbers.

Ans: The first five whole numbers are 0, 1, 2, 3, 4.

Arithmetic mean is the sum of all observations divided by total number of observations.

$\text{Mean=}\dfrac{\text{Sum of all observations}}{\text{Number of observations}} \\ $

$ \text{=}\dfrac{0+1+2+3+4}{5} \\ $

$ \text{=}\dfrac{10}{5} \\ $

$ \text{=2} \\ $

Hence, the mean of the first five natural numbers is 2.


4. A cricketer scores the following runs in eight innings: 58, 76, 40, 35, 46, 45, 0, 100. Find the mean score.

Ans: Arithmetic mean is sum of all observations divided by total number of observations.

Number of Observations= 8

$ \text{Mean=}\dfrac{\text{Sum of all observations}}{\text{Number of observations}} \\ $

$ \text{=}\dfrac{58+76+40+35+46+45+0+100}{8} \\ $

$ \text{=}\dfrac{400}{8} \\ $

$ \text{=50} \\ $

Hence, the mean score of the cricketer is 50.


5. Following table shows the points each player scored in four games.

Player

Game 1

Game 2

Game 3

Game 4

A

14

16

10

10

B

0

8

6

4

C

8

11

Did not play

13


Now answer the following questions.

(i) Find the mean to determine A’s average number of points scored per game.

(ii) To find the mean number of points per game for C, would you divide the total points by 3 or 47? Why? 

(iii) B played in all the four games. How would you find the meaning? 

(iv) Who is the best performer?

Ans:

(i) The average of player A can be determined by dividing the sum of all scores of A by the number of games he played. 

$ \text{Mean of player A=}\dfrac{\text{Sum of scored by A}}{\text{Number of games played by A}} \\ $

$ \text{=}\dfrac{14+16+10+10}{4} \\ $

$ \text{ =}\dfrac{50}{4} \\ $

$ \text{ =12}\text{.5} \\ $

Hence, the average number of points scored by A is 12.5.


(ii)For finding average points scored, we divide the total scores by the total number of games played. In this case, C has played 3 games and therefore we will divide the total points by 3 and not by 4.


(iii)B played all 4 games. So, we will divide the total points scored by 4.

$ \text{Mean of player B=}\dfrac{\text{Sum of scored by B}}{\text{Number of games played by B}} \\ $

$ \text{=}\dfrac{0+8+6+4}{4} \\ $

$ \text{=}\dfrac{18}{4} \\ $

$ \text{=4}\text{.5} \\ $


(iv)Best performer is the one who has the highest average score among all the other players.

$ \text{Mean of player A=}\dfrac{\text{Sum of scored by A}}{\text{Number of games played by A}} \\ $

$ \text{=}\dfrac{14+16+10+10}{4} \\$ 

$ \text{=}\dfrac{50}{4} \\ $

$ \text{=12}\text{.5} \\ $

$ \text{Mean of player B=}\dfrac{\text{Sum of scored by B}}{\text{Number of games played by B}} \\ $

$ \text{=}\dfrac{0+8+6+4}{4} \\ $

$ \text{=}\dfrac{18}{4} \\ $

$ \text{=4}\text{.5} \\ $

$  \text{Mean of player C=}\dfrac{\text{Sum of scored by C}}{\text{Number of games played by C}} \\ $

$ \text{=}\dfrac{8+11+13}{3} \\ $

$ \text{=}\dfrac{32}{3} \\ $

$ \text{=10}\text{.67} \\ $

On comparing means of all players, we can see that the average score of player A is the highest, i.e., 12.5.

Hence, player A is the best performer.


6. The marks (out of 100) obtained by a group of students in a science test are 85, 76, 90, 85, 39, 48, 56, 95, 81 and 75. Find the: 

(i) The highest and the lowest marks obtained by the students. 

(ii) Range of the marks obtained. 

(iii) Mean marks obtained by the group.

Ans:

(i) Highest marks obtained by the student = 95

Lowest marks obtained by the student = 39


(ii) We will find the range of marks by getting the difference between the highest value and lowest value.

Range= Highest value – Lowest value

$ =95-39 \\ $

$ =56 \\ $

Hence, the range of marks obtained is 56.


(iii) For finding average marks scored, we divide the total scores by the total number of observations.

 $ \text{Mean of obtained marks=}\dfrac{\text{Sum of marks}}{\text{Total number of marks}} \\ $

$ \text{=}\dfrac{85+76+90+85+39+48+56+95+81+75}{10} \\ $

$ \text{=}\dfrac{730}{10} \\$ 

$ \text{=73} \\ $

Hence, the mean marks obtained by the group of students is 73.


7. The enrolment in a school during six consecutive years was as follows: 1555, 1670, 1750, 2013, 2540, 2820. Find the mean enrolment of the school for this period.

Ans: To find the mean enrolment, we will divide the sum of numbers of enrolment by the number of years of enrolment period.

$ \text{Mean enrolment=}\dfrac{\text{Sum of number of enrolment}}{\text{Total number of years}} \\$ 

$ \text{=}\dfrac{1555+1670+1751+2013+2540+2820}{6} \\ $

$ \text{=}\dfrac{12348}{6} \\ $

$ \text{=2058} \\ $

Hence, the mean enrolment of school over 6 years is 2058.


8. The rainfall (in mm) in a city on 7 days of a certain week recorded as follows

Day

Mon

Tue

Wed

Thurs

Fri

Sat

Sun

Rainfall

(in mm)

0.0

12.2

2.1

0.0

20.5

5.5

1.0

(i) Find the range of the rainfall in the above data.

(ii) Find the mean rainfall for the week.

(iii) On how many days was the rainfall less than the mean rainfall.

Ans

(i) Range of rainfall = Highest rainfall - lowest rainfall

= 20.5 - 0.0

= 20.5 mm


(ii) Mean of a rainfall = $\dfrac{\text{Sum of all Observations}}{\text{Number of observations}}\\ $

= $\dfrac{0.0+12.2+2.1+0.0+20.5+5.5+1.0}{7}$

=$\dfrac{41.3}{7}$

=5.9 mm


(iii) From the mean calculated in (ii) we may observe that for 5 days those are Monday, Wednesday, Thursday, Saturday and Sunday, the rainfall was less than the average rainfall.


9. The height of 10 girls were measured in cm and the results are as follows: 135, 150, 139, 128, 151, 132, 146, 149, 143, 141 

(i) What is the height of the tallest girl? 

(ii) What is the height of the shortest girl? 

(iii) What is the range of data? 

(iv) What is the mean height of the girls? 

(v) How many girls have heights more than the mean height?

Ans: 

(i)As seen from the above given data, the height of the tallest girl is 151cm.

(ii)As seen from the above given data, the height of the shortest girl is 128cm.

(iii)We will find the range of heights by getting the difference between the highest value and lowest value.

$ \text{Range= Highest Value}-\text{Lowest Value} \\ $

$ \text{=151-128} \\ $

$ \text{=23} \\ $

Hence, the range of heights is 23cm.


(iv)To find the mean height, we will divide the sum of heights of all girls by the number of girls.

$ \text{Mean of height=}\dfrac{\text{Sum of heights of all girls}}{\text{Total number of girls}} \\ $

$ \text{=}\dfrac{135+150+139+128+151+132+146+149+143+141}{10} \\$ 

$ \text{=}\dfrac{1414}{10} \\ $

$ \text{=141}\text{.4} \\ $

Hence, the mean height of girls is 141.4cm.


(v) Mean height is 141.4cm. From the above data, we can see that heights 150, 151, 146, 149 and 143 are more than the mean value. 

Hence, five girls have heights more than the mean height.


Exercise 3.2

1. The scores in mathematics test (out of 25) of students is as follows:

\[19,25,23,20,9,20,15,10,5,16,25,20,24,12,20\]

Find the mode and median of this data. Are they same?

Ans. Arranging data in ascending order

\[5,9,10,12,15,16,19,20,20,20,20,23,24,25,25\]

Mode is maximum occurring observation

Since \[20\] occurs \[4\] times,

Mode \[ = 20\]

Number of observation \[ = 15\]

Median \[ = {\left( {\dfrac{{n + 1}}{2}} \right)^{th}}\]observation

\[ = {\left( {\dfrac{{15 + 1}}{2}} \right)^{th}}\]

\[ = {\left( {\dfrac{{16}}{2}} \right)^{th}}\]

\[ = {8^{{\text{th }}}}\]observation 

\[ = 20\]

So, both mode and median are \[20\]

Hence, they are same.

2. The runs scored in a cricket match by \[11\] players is as follows:

\[6,15,120,50,100,80,10,15,8,10,15\]

Find the mean, mode and median of this data. Are the three same?

Ans. Runs scored in the match $ = 6,15,120,50,100,80,10,15,8,10,15$

Arranging in ascending order $ = 6,8,10,10,15,15,15,50,80,100,120$,

Here, \[15\] occurs the maximum number of times. Hence, the mode of the data is \[15\]

Now,

Mean $ = \dfrac{{{\text{ Sum of scores }}}}{{{\text{ Number of players }}}}$

$ = \dfrac{{6 + 8 + 10 + 10 + 15 + 15 + 15 + 50 + 80 + 100 + 120}}{{11}}$

$ = \dfrac{{429}}{{11}} = 39$

Therefore, the mean score is \[39\]

Now, the median is the middle observation of the data.

There are \[11\] terms. 

Therefore, the middle observation is $\dfrac{{11 + 1}}{2} = {6^{th}}$ term

Therefore, the median of the data is \[15\] .

The mean, median and mode are not the same.

3. The weight (in ${\text{kg}}$) of \[15\] students of a class are:

\[38,42,35,37,45,50,32,43,43,40,36,38,43,38,47\]

(i) Find the mode and median of this data.

Ans. Given, weights of \[15\]students (in${\text{kg}}) = 38,42,35,37,45,50,32,43,43,40,36,38,43,38,47$

Arranging the data in ascending order $ = 32,35,36,37,38,38,38,40,42,43,43,43,45,47,50$

So, \[38\] and \[43\] both occur thrice. So, both \[38\] and \[43\] are the mode of the data.

Now, there are \[15\] values,

So, the median is the $\dfrac{{15 + 1}}{2} = {8^{th}}$ term

Hence, the median value is \[40\].

(ii) Is there more than one mode?

Yes, there are two modes in this data.

4. Find the mode and median of the data:

\[13,16,12,14,19,12,14,13,14\]

Ans. Given, \[13,16,12,14,19,12,14,13,14\]

Arranging in ascending order $ = 12,12,13,13,14,14,14,16,19$

Mode is that observation which occurs the maximum number of times.

Median is the middle observation of the data when the data is arranged in ascending or descending order.

So, \[14\]occurs thrice. 

So, the mode is \[14\].

Now, there are 9 values,

So, the median is the $\dfrac{{9 + 1}}{2} = {5^{{\text{th }}}}$ term

Hence, \[14\] is the median value.

5. Tell whether the statement is true or false:

(i) The mode is always one of the numbers in a data.

Ans. True.

Mode is that observation which occurs the maximum number of times.


(ii) The mean is one of the numbers in a data.

Ans. False.


(iii) The median is always one of the numbers in a data.

Ans. False.


For even number of observations, the median is the mean of the \[\dfrac{{n{\text{ }}}}{2}\] and \[{\left( {\dfrac{{n + 1}}{2}} \right)^{th}}\] values.

(iv) The data \[6,4,3,8,9,12,13,9\] has mean \[9.\]

Ans. Mean \[ = \dfrac{{{\text{ Sum of observations }}}}{{{\text{ Number of observations }}}}\]

\[ = \dfrac{{6 + 4 + 3 + 8 + 9 + 12 + 13 + 9}}{8}\]

\[ = \dfrac{{64}}{8}\]

\[ = 8\]

Hence, the statement is False.


Exercise 3.3

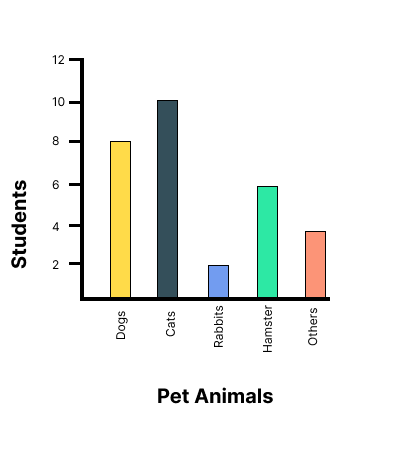
1. Use the bar graph to answer the following questions:


the bar representing cats is the tallest


(a) Which is the most popular pet?

Ans: Since the bar representing cats is the tallest, Cat is the most popular pet.


(b) How many students have dog as a pet?

Ans: From the bar graph, 8 students have a dog as a pet.


2. Read the bar graph which shows the number of books sold by a bookstore during five consecutive years and answer the following questions:


the bar graph which shows the number of books sold by a bookstore during five consecutive years


(i) About how many books were sold in 1989? 1990? 1992?

Ans: (a) In 1989, 180 books were sold.

(b) In 1990, 475 books were sold.

(c) In 1992, 225 books were sold.


(ii) In which year were about 475 books sold? About 225 books sold?

Ans: From the graph, in 1990, about 475 books were sold and in 1992, about 225 books were sold.


(iii) In which years were fewer than 250 books sold?

Ans: From the graph, it can be concluded that in 1989 and 1992 fewer than 250 books were sold.


(iv) Can you explain how you would estimate the number of books sold in 1989?

Ans: From the graph, it can be concluded that the number of books sold in the year 1989 is about 1 and \[\dfrac{3}{4}{\text{th }}\] part of \[{\text{1cm}}\].

We know that the scale is taken as \[{\text{1cm }} = {\text{ 100 books}}\].

\[100 + \dfrac{3}{4} \times 100 = 100 + 75 = 175\]

Therefore, about 175 books were sold in the year 1989.


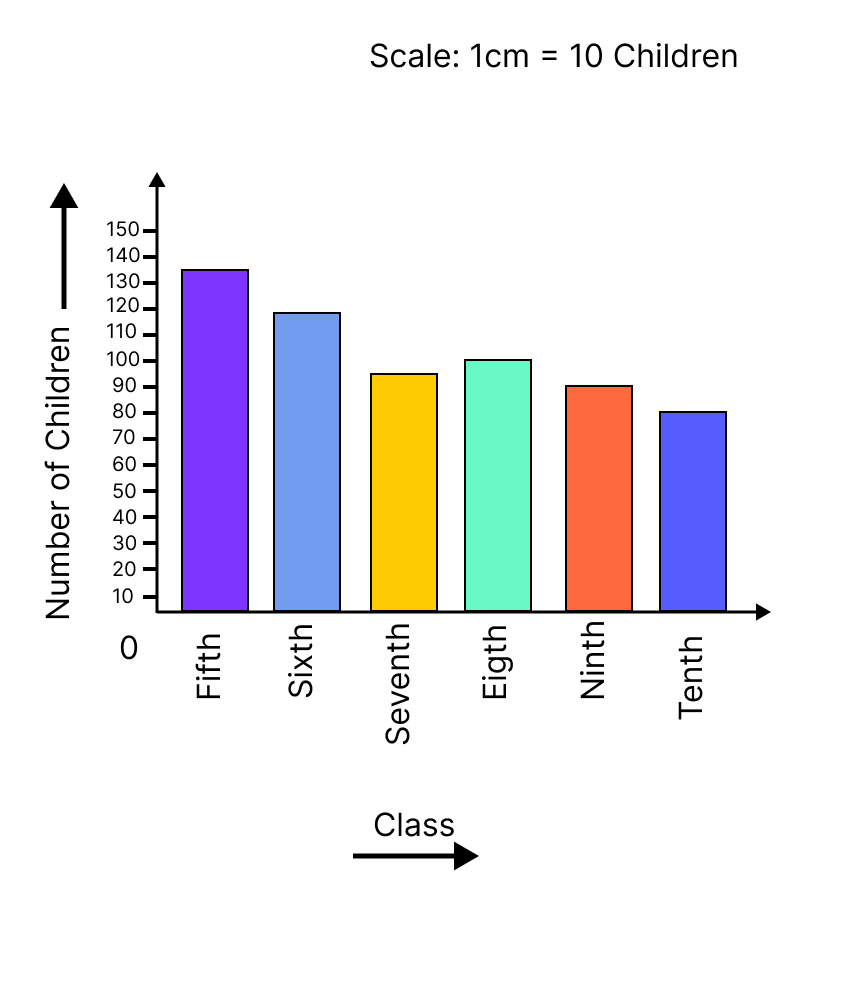
3. Number of children in six different classes are given below. Represent the data on a bar graph.


Class

Fifth

Sixth

Seventh

Eighth

Ninth

Tenth

No.of children

135

120

95

100

90

80


(a) How would you choose a scale?


How would you choose a scale


Ans: We will choose a scale as 1 unit = 10 children because we can represent a more clear difference between the number of students of class 7th and that of class 9th by this scale.


(b) Answer the following questions:

(i) Which class has the maximum number of children? And the minimum?

Ans:  Since the bar representing the number of children for class fifth is the tallest, there are maximum number of children in class fifth. Similarly, since the bar representing the number of children for class tenth is the smallest, there are minimum number of children in class tenth.


(ii) Find the ratio of students of class sixth to the students of class eighth.

Ans: The number of students in class sixth is 120 and the number of students in class eighth is 100.

Therefore, the ratio \[{\text{ = }}\dfrac{{{\text{the number of students of class sixth}}}}{{{\text{the number of students of class eighth}}}}\]

\[ = \dfrac{{120}}{{100}} = \dfrac{6}{5} = 6:5\]


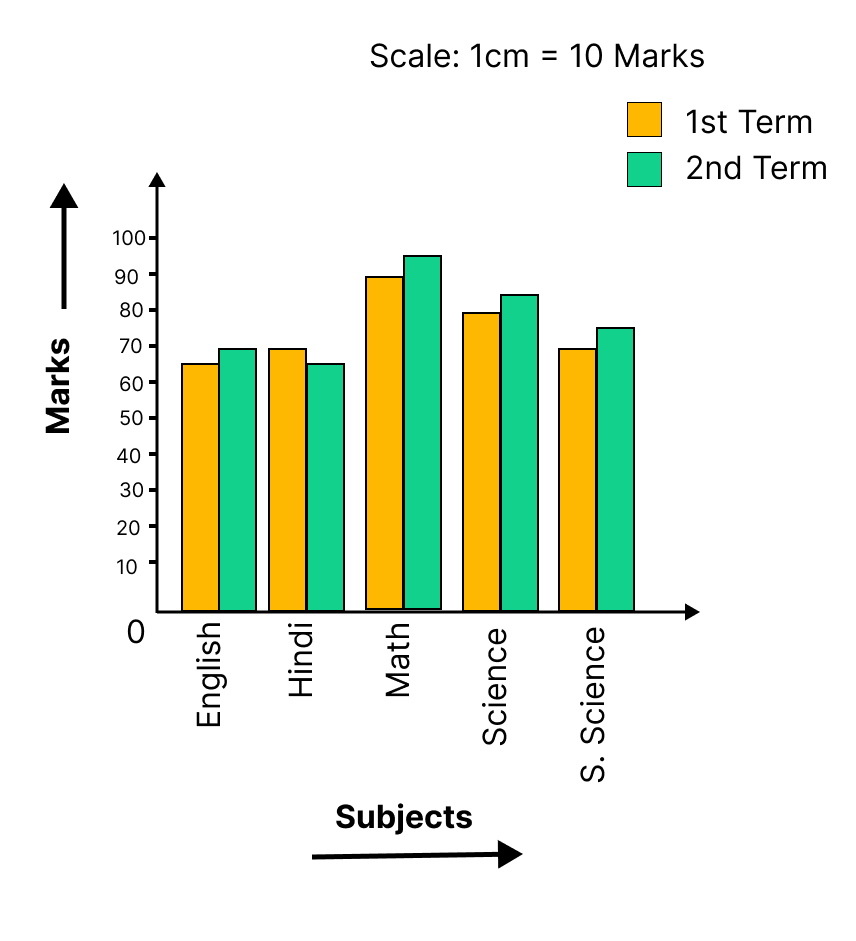
4. The performance of a student in \[{1^{st}}\] term and \[{2^{nd}}\] term is given. Draw a double bar graph choosing appropriate scale and answer the following:

Subject

English

Hindi

Maths

Science

S.Science

1st term

67

72

88

81

73

2nd term

70

65

95

85

75


a double bar graph choosing appropriate scale


The difference of marks in both terms of each subject.

English \[ = 70 - 67 = 3\]

Hindi \[ = 65 - 72 =  - 7\]

Maths \[ = 95 - 88 = 7\]

Science \[ = 85--81 = 4\]

S. Science \[ = 75--73 = 2\]

(i) In which subject has the child improved his performance the most?

Ans: There was a maximum increase in the marks obtained in Maths, which is 7 marks. Therefore, the child has improved his performance the most in Maths.


(ii) In which subject is the improvement the least?

Ans: From the graph, it can be concluded that he only improved 2 marks in S.Science. Therefore, the improvement was the least in S. Science.


(iii) Has the performance gone down in any subject?

Ans: From the graph, it can be observed, in Hindi his marks decreased from 72 to 65. Therefore, in Hindi, his performance has gone down.


5. Consider this data collected from a survey of a colony.

Favourite sport

Cricket

Basket

Ball

Swimming

Hockey

Athletics

Watching

1240

470

510

423

250

Participating

620

320

320

250

105


(i) Draw a double bar graph choosing an appropriate scale. What do you infer from the bar graph?

Ans: A double bar graph for the given data is as follows.


The double bar graph represents the number of people who like watching and participating in different sports activites


The double bar graph represents the number of people who like watching and participating in different sports. It can be observed that most of the people like watching and participating in cricket while the least number of people like watching and participating in athletics.


(ii) Which sport is most popular?

Ans: From the bar graph, it can be observed that the bar representing the number of people who like watching and participating in cricket is the tallest among all the bars. Hence, cricket is the most popular sport.


(iii) Which is more preferred, watching or participating in sports?

Ans: The bars representing watching sport are longer than the bars representing participating in sport. Hence, watching different types of sports is more preferred than participating in the sports.


6. Take the data giving the minimum and the maximum temperature of various cities given in the beginning of this Chapter. Plot a double bat graph using the data and answer the following:

Temperatures of the cities on 20.6.2006

City

Ahmedabad

Amritsar

Bangalore

Chennai

Max.

Min.

\[{38^ \circ }{\text{C}}\]

\[{37^ \circ }{\text{C}}\]

\[{28^ \circ }{\text{C}}\]

\[{36^ \circ }{\text{C}}\]

\[{29^ \circ }{\text{C}}\]

\[{26^ \circ }{\text{C}}\]

\[{21^ \circ }{\text{C}}\]

\[{27^ \circ }{\text{C}}\]

City

Delhi

Jaipur

Jammu

Mumbai

Max.

\[{38^ \circ }{\text{C}}\]

\[{39^ \circ }{\text{C}}\]

\[{41^ \circ }{\text{C}}\]

\[{32^ \circ }{\text{C}}\]

Min.

\[{28^ \circ }{\text{C}}\]

\[{29^ \circ }{\text{C}}\]

\[{26^ \circ }{\text{C}}\]

\[{27^ \circ }{\text{C}}\]


(i) Which city has the largest difference in the minimum and maximum temperature on the given data?

Ans: A double bar graph for the given data is constructed as follows.


it can be concluded that Jammu has the largest difference in its minimum and maximum temperatures


From the graph, it can be concluded that Jammu has the largest difference in its minimum and maximum temperatures on 20.6.2006.

i.e. Maximum temperature \[ = \]\[{41^ \circ }{\text{C}}\] Minimum temperature \[ = \]\[{26^ \circ }{\text{C}}\]

Therefore, Difference \[ = {41^ \circ }{\text{C}} - {26^ \circ }{\text{C = }}{15^ \circ }{\text{C}}\]


(ii) Which is the hottest city and which is the coldest city?

Ans: From the graph, it can be concluded that Jammu is the hottest city due to maximum temperature and Bangalore is the coldest city due to lowest minimum temperature.


(iii) Name two cities where maximum temperature of one was less than the minimum temperature of the order.

Ans: Bangalore and Jaipur, Bangalore and Ahmedabad.

For Bangalore, the maximum temperature was \[{28^ \circ }{\text{C}}\], while minimum temperature of both cities, Ahmedabad and Jaipur, was \[{29^ \circ }{\text{C}}\].


(iv) Name the city which has the least difference between its minimum and the maximum temperature.

Ans: From the graph, it can be concluded that the city which has the least difference between its minimum and maximum temperatures is Mumbai.

i.e. Maximum temperature \[ = {32^o}{\text{C}}\]Minimum temperature \[ = {27^o}{\text{C}}\]

Therefore, Difference \[ = {32^o}{\text{C}} - {27^o}{\text{C}} = {5^o}{\text{C}}\]


Overview of Deleted Syllabus for CBSE Class 7 Maths Data Handling

Chapter

Dropped Topics

Data Handling

3.1 Introduction

3.2 Collecting data

3.3 Organisation of data 

3.9 Chance and probability.


Class 7 Maths Chapter 3: Exercises Breakdown

Exercise

Number of Questions

Exercise 3.1

9 Questions and Solutions (5 Short Answers and 4 Long Answers)

Exercise 3.2

5 Questions and Solutions (2 are Short Answers and 3 are Long Answers)

Exercise 3.3

6 Questions and Solutions (3 for Long Answers and 3 for Short Answers)


Conclusion

Class 7 Chapter 3 Maths, "Data Handling," is fundamental to building a solid understanding of managing and interpreting data. Data Handling is a valuable skill used in various fields. By mastering this chapter, you'll be able to make sense of information around you and draw meaningful conclusions.


This chapter builds a solid understanding of how to manage and interpret data. Students can enhance their analytical skills and apply them in various real-world scenarios by mastering these concepts. This is crucial for understanding more complex topics in statistics and probability. 

Other Study Material for CBSE Class 7 Maths Chapter 3


Chapter-Specific NCERT Solutions for Class 7 Maths

Given below are the chapter-wise NCERT Solutions for Class 7 Maths. Go through these chapter-wise solutions to be thoroughly familiar with the concepts.


Important Related Links for NCERT Class 7 Maths

Access these essential links for NCERT Class 7 Maths, offering comprehensive solutions, study guides, and additional resources to help students master language concepts and excel in their exams.


FAQs on NCERT Solutions for Class 7 Maths Chapter 3 Data Handling

1. Why should we learn all the concepts present in NCERT Solutions for Class 7 Maths Chapter 3?

The concepts described in Chapter Data Handling explain the fundamentals required to collect, analyze and understand data. Learning the concepts of data handling can enable students to make sense out of large amounts of data and also provide them with appropriate tools to organize and represent data in a meaningful way. 

2. How many exercises are there in NCERT Solutions for Class 7 Maths Chapter 3?

There are four exercises in total, including Exercise 3.1- nine sums ( five short and four long answers), Exercise 3.2- five sums( two short and three long types), Exercise 3.3- six sums (three short and three long types) and Exercise 3.4- four sums (two short and two long types). 


Solutions for all the chapters are written in an easy to understand language by subject matter experts. Vedantu’s NCERT Solutions for Class 7 Maths Data Handling will not only help students understand the concept but also help understand the syllabus and exam pattern. 

3. Do I need to practise all questions provided in NCERT Solutions Class 7 Maths Data Handling?

Yes. Each question is designed in a way that will help students in understanding the fundamental concepts better and enable them to solve various kinds of problems related to data handling. It will strengthen the basics of the students in the topic so they can easily solve difficult problems and score better in exams. 

4. What is Data Handling in Maths Class 7?

The chapter on Data Handling in Maths Class 7 introduces students to different methods of data collection and describes the various steps involved in collecting, analyzing, and evaluating data. It also teaches students the different forms of representing data like graphs, pie charts, etc., and helps them in understanding the basics of organizing data in a meaningful way.

5. How do you teach Data Handling to Grade 7?

To teach a topic like data handling to 7th grade, a gradual approach is essential so that students with different learning paces can understand the basics and can apply them in problem-solving. Solving exercise questions can help with that. Vedantu provides clear and detailed solutions to NCERT exercise questions so that students can understand the concepts and master the fundamentals and apply them to solve any questions confidently.

6. What topics are covered in Class 7 Chapter 3 Maths?

Class 7 Chapter 3 Maths, titled "Data Handling," covers the following topics:

  • Data collection and organization

  • Frequency distribution tables

  • Mean, median, and mode

  • Bar graphs, double bar graphs, and pie charts

7. What is data handling as per NCERT Class 7 Maths Chapter 3?

As per NCERT Class 7 Maths Chapter 3, Data handling involves collecting, organizing, and interpreting data to make meaningful inferences. It includes creating frequency tables, calculating measures of central tendency (mean, median, mode), and representing data graphically using bar graphs and pie charts.

8. How is data organized in Chapter 3 Class 7 Maths?

Data is organized in a frequency distribution table. This table lists data points and their corresponding frequencies, helping to organize data systematically and making it easier to interpret.

9. What is a bar graph, and how is it used in Chapter 3 Class 7 Maths?

A bar graph is a graphical representation of data using rectangular bars. Each bar's height or length represents the frequency or value of a data category. Bar graphs are used to visually compare different categories of data.

10. What is the significance of double bar graphs in Class 7 Maths Chapter 3 Solutions PDF?

Double bar graphs are used to compare two sets of data side by side. Each category is represented by two bars, often of different colours, allowing for a clear comparison between the data sets.