Courses
Courses for Kids
Free study material
Offline Centres
More
Store Icon
Store

NCERT Solutions for Class 9 Maths Chapter 12 - Statistics Exercise 12.1

ffImage

NCERT Solutions for Class 9 Maths Exercise 12.1 Chapter 12 Statistics - FREE PDF Download

NCERT Ex 12.1 Class 9th Maths Solutions by Vedantu provides all the material to make students understand all the concepts, formulas and equations related to the chapter before they give the exam. Our team of expert teachers ensure to put their expertise and knowledge to tailor these solutions in the best possible way. Class 9 Maths Chapter Statistics Exercise 12.1 focuses on measures of central tendency, specifically the mean, median, and mode of data. This exercise helps students understand how to calculate these measures for a given data set, interpret the results, and apply these concepts to real-life situations. By working through the problems, students learn to summarize data effectively, which is essential for data analysis in various fields. These notes contain both the solved examples and previous years' question papers to get thorough knowledge on the subject.

toc-symbol
Table of Content
1. NCERT Solutions for Class 9 Maths Exercise 12.1 Chapter 12 Statistics - FREE PDF Download
2. Glance on NCERT Solutions Class 9 Maths Statistics Exercise 12.1| Vedantu
3. Formulas Used in Chapter 12 Statistics Exercise 12.1
4. Access NCERT Solutions for Class 9 Maths Chapter 12 Statistics Exercise 12.1
5. Conclusion
6. CBSE Class 9 Maths Chapter 12 Other Study Materials
7. Chapter-Specific NCERT Solutions for Class 9 Maths
8. Important Study Materials for CBSE Class 9 Maths
FAQs


Glance on NCERT Solutions Class 9 Maths Statistics Exercise 12.1| Vedantu

  • A collection of information for a definite purpose is known as data

  • Statistics mainly deals with the analysis, presentation and interpretation of data. 

  • In statistics, data can be represented as histograms,  bar graphs and polygons

  • The central tendency of ungrouped data is measured in three ways. They are mean, median and mode.

  • This exercise primarily deals with the creation and interpretation of frequency tables.

  • It includes problems that require students to organize raw data into a frequency distribution table.


Formulas Used in Chapter 12 Statistics Exercise 12.1

  1. Mean (Arithmetic Mean):

$\text{Mean} (\overline{x}) = \dfrac{\sum x_i}{n}$


  1. Median:

$\text{Median} = \left(\dfrac{n+1}{2}\right)^{\text{th}} \text{ value}$

$\text{Median} = \dfrac{\left(\frac{n}{2}\right)^{\text{th}} \text{ value} + \left(\dfrac{n}{2} + 1\right)^{\text{th}} \text{ value}}{2}$

Competitive Exams after 12th Science
tp-imag
bottom-arrow
tp-imag
bottom-arrow
tp-imag
bottom-arrow
tp-imag
bottom-arrow
tp-imag
bottom-arrow
tp-imag
bottom-arrow
Watch videos on

NCERT Solutions for Class 9 Maths Chapter 12 - Statistics Exercise 12.1
Previous
Next
Vedantu 9&10
Subscribe
iconShare
STATISTICS in One Shot (Complete Chapter) CBSE Class 9 Math Chapter 14 [Term 1 Exam] NCERT Vedantu
5.6K likes
120.8K Views
3 years ago

Access NCERT Solutions for Class 9 Maths Chapter 12 Statistics Exercise 12.1

1. A survey conducted by an organisation for the cause of illness and death among the women between the ages \[15 - 44\] (in years) worldwide, found the following figures (in %)


S.No

Causes

Female Fatality Rate (% )

1

Reproductive health conditions

31.8

2

Neuropsychiatric conditions

25.4

3

Injuries

12.4

4

Cardiovascular conditions

4.3

5

Respiratory conditions

4.1

6

Other causes

22.0


i. Represent the information given above graphically.

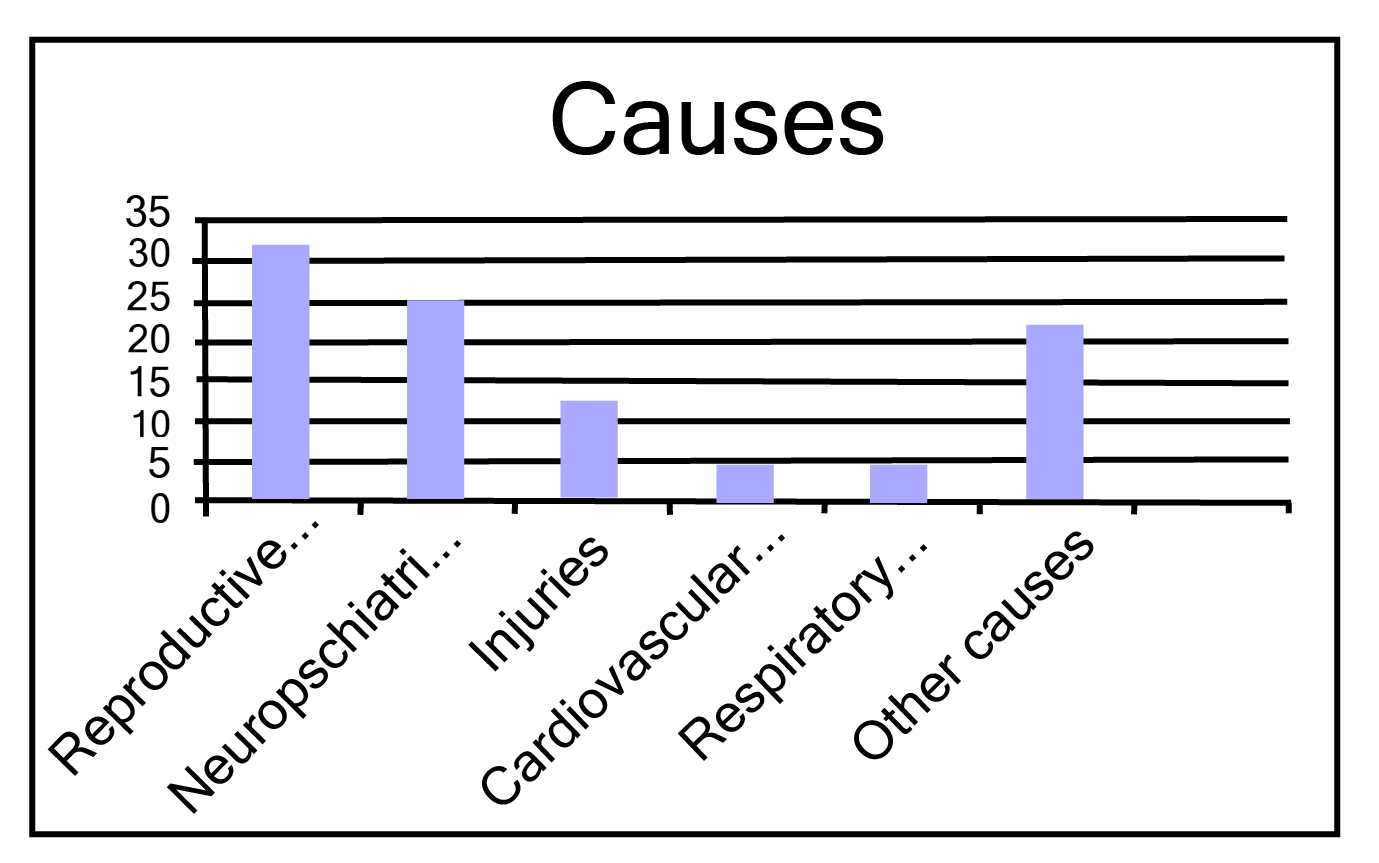
Ans: The graph of the information presented above can be produced as follows by depicting causes on the x-axis and family fatality rate on the y-axis, and selecting an acceptable scale (1 unit = 5% for the y axis).

Causes


All the rectangle bars are of the same width and have equal spacing between them.


ii. Which condition is the major cause of womenโ€™s ill health and death worldwide?

Ans: Reproductive health issues are the leading cause of women's illness and mortality globally, affecting 31.8% of women.


iii. Try to find out, with the help of your teacher, any two factors which play a major role in the cause in (ii) above being the major cause

Ans: The factors are as follows:

a. Lack of medical facilities

b. Lack of correct knowledge of treatment


2. The following data on the number of girls (to the nearest ten) per thousand boys in different sections of Indian society is given below:

Section 

Number of Girls Per Thousand Boys

Scheduled caste (SC)

Scheduled tribe (ST)

Non SC/ST

Backward districts

Non โ€“ backward districts

Rural

Urban 

940

970

920

950

920

930

910


i. Represent the information above by a bar graph.

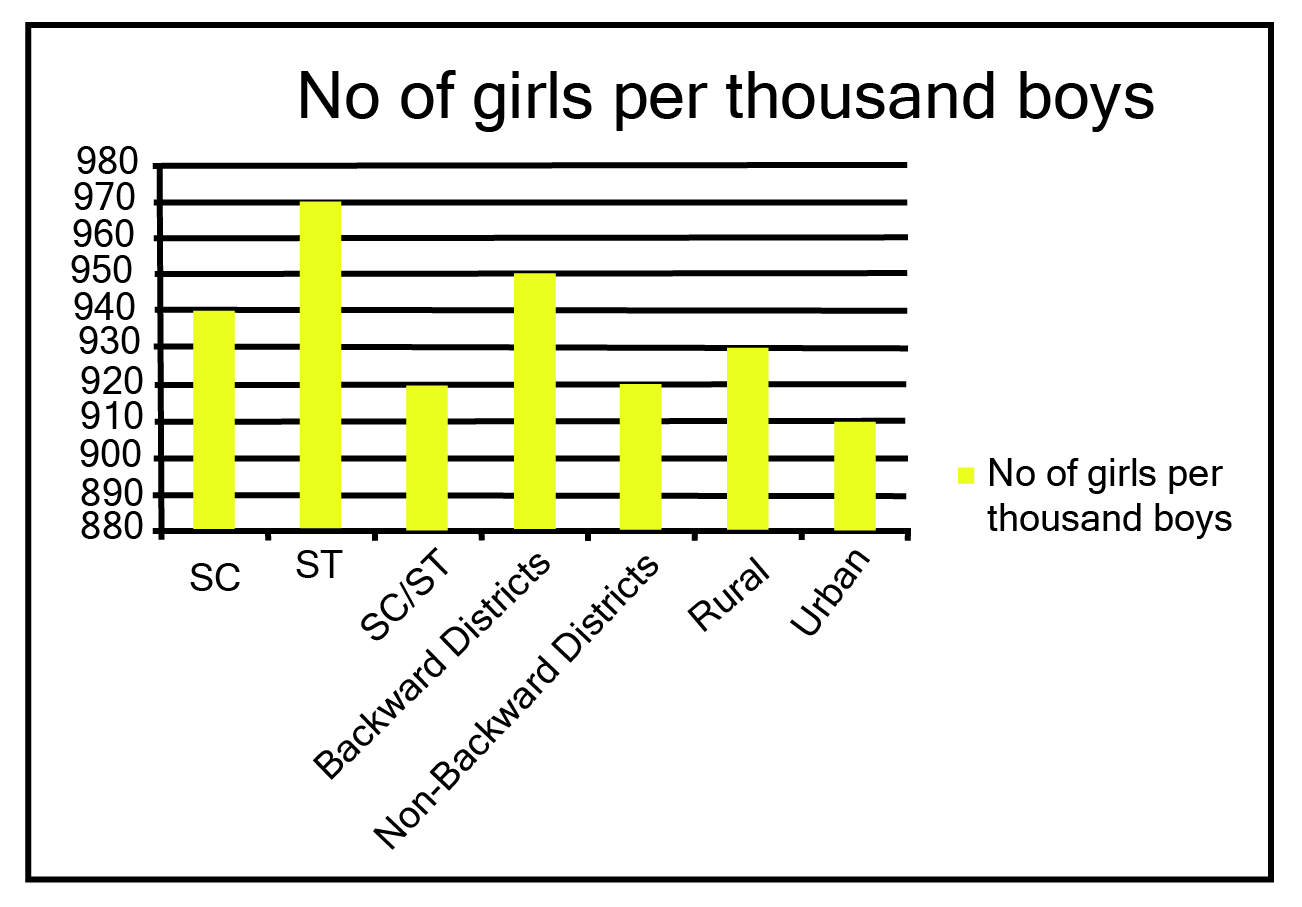
Ans: The graph of the information presented above may be built by choosing an appropriate scale (1 unit = 100 girls for the y-axis) and representing section (variable) on the x-axis and number of girls per thousand boys on the y-axis.

No. of girls per thousand boys


Here, all the rectangle bars are of the same length and have equal spacing in between them.


ii. In the classroom discuss what conclusions can be arrived at from the graph.

Ans: The largest number of females per thousand boys (i.e., 970) is found in ST, while the lowest number of girls per thousand boys (i.e., 910) is found in urban areas. 

In addition, the number of females per thousand boys is higher in rural regions than in cities, in backward districts than in non-backward districts, and in SC and ST districts than in non-SC/ST districts.


3. Given below are the seats won by different political parties in the polling outcome of a state assembly elections:

Political Party

A

B

C

D

E

F

Seats Won

75

55

37

29

10

37


i. Draw a bar graph to represent the polling results.

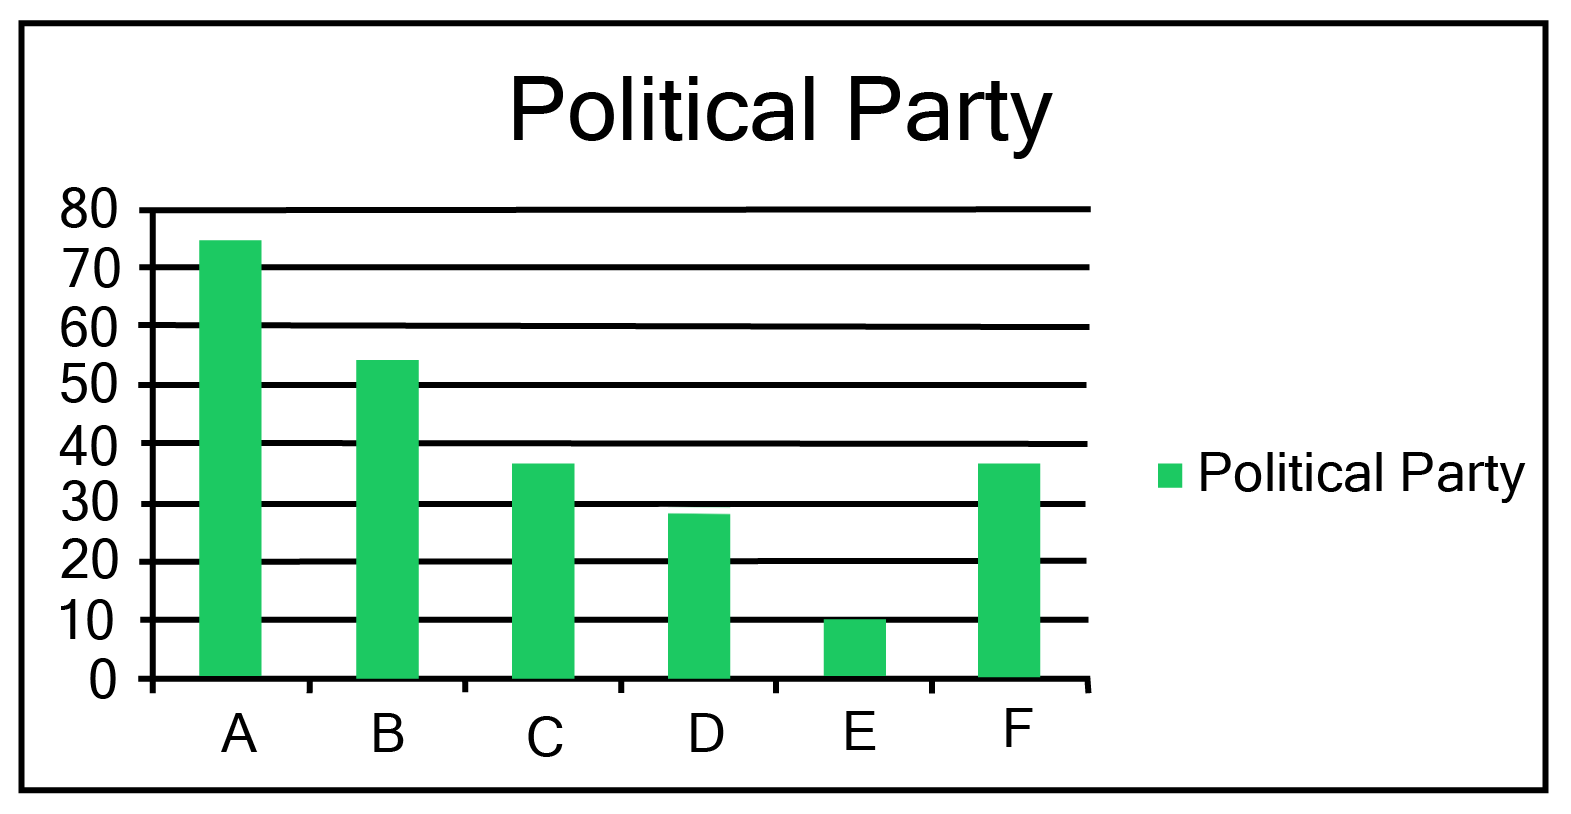
Ans:

Political party


Here, all the rectangle bars are of the same length and have equal spacing in between them.

ii. Which political party won the maximum number of seats?

Ans: From the above graph it is clear that Political party โ€˜Aโ€™ won the maximum number of seats.


4. The length of\[40\] leaves of a plant are measured correct to one millimeter, and the obtained data is represented in the following table:


Length (in mm)

Number of Leaves

117.5-126.5

3

126.5-135.5

5

135.5-144.5

9

144.5-153.5

12

135.5-162.5

5

162.5-171.5

4

171.5-180.5

2


i. Draw a histogram to represent the given data.

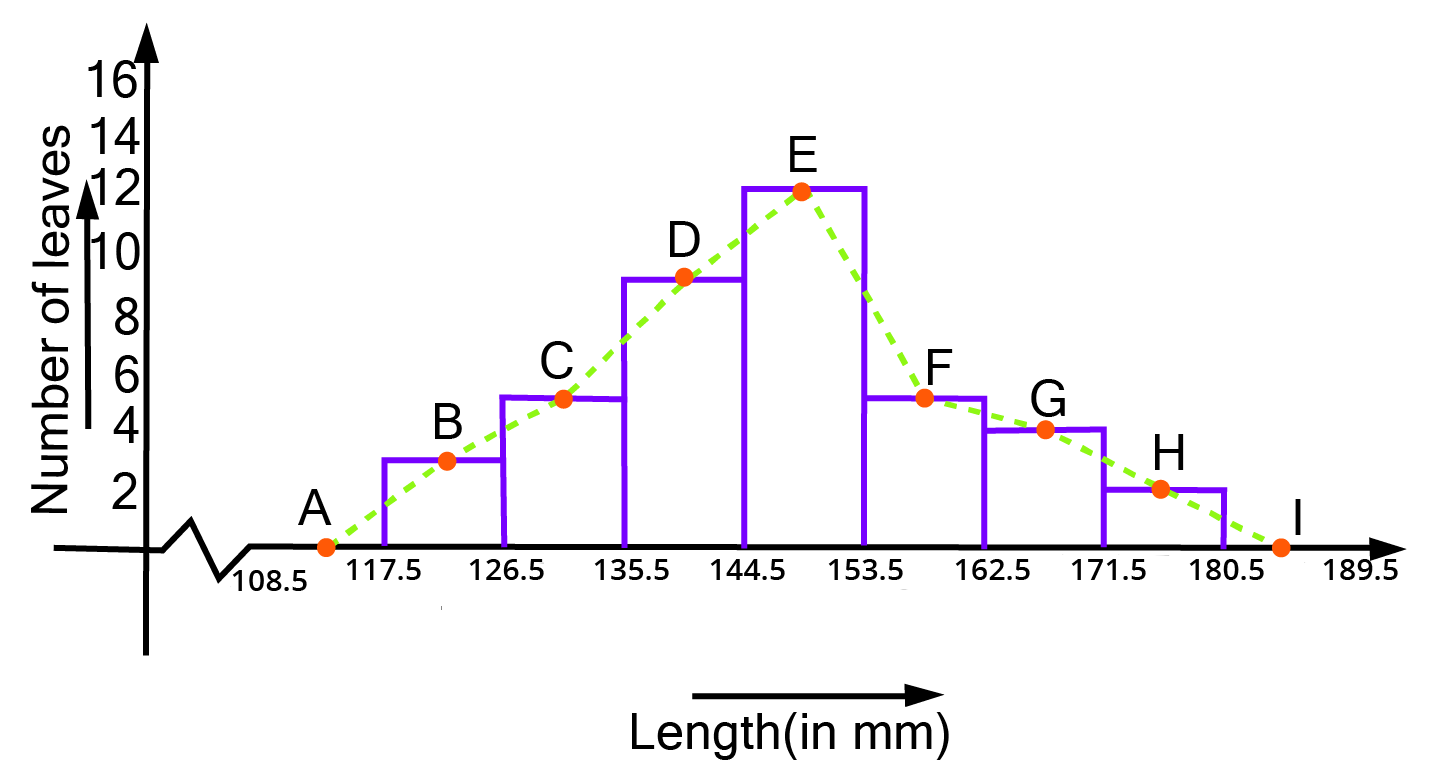
Ans: The length of leaves is represented in a discontinuous class interval with a difference of \[1\] between them, as can be seen. To make the class intervals continuous, \[\dfrac{1}{2} = 0.5\] must be added to each upper class limit and \[0.5\] must be subtracted from the lower class limits.


Length (in mm)

Number of Leaves

117.5-126.5

3

126.5-135.5

5

135.5-144.5

9

144.5-153.5

12

135.5-162.5

5

162.5-171.5

4

171.5-180.5

2


A discontinuous class interval


The above histogram may be built using the length of leaves on the x-axis and the number of leaves on the y-axis.

On the y-axis, one unit symbolises two leaves.


ii. Is there any other suitable graphical representation for the same data?

Ans: Frequency polygon is another good graphical representation of this data.


iii. Is it correct to conclude that the maximum number of leaves are 153 mm long? Why?

Ans: No, because the maximum number of leaves (i.e.\[12\]) has a length of \[144.5{\text{mm}}\] to \[153.5{\text{mm}}\] It is not necessary for all of them to be \[153{\text{mm}}\]long.


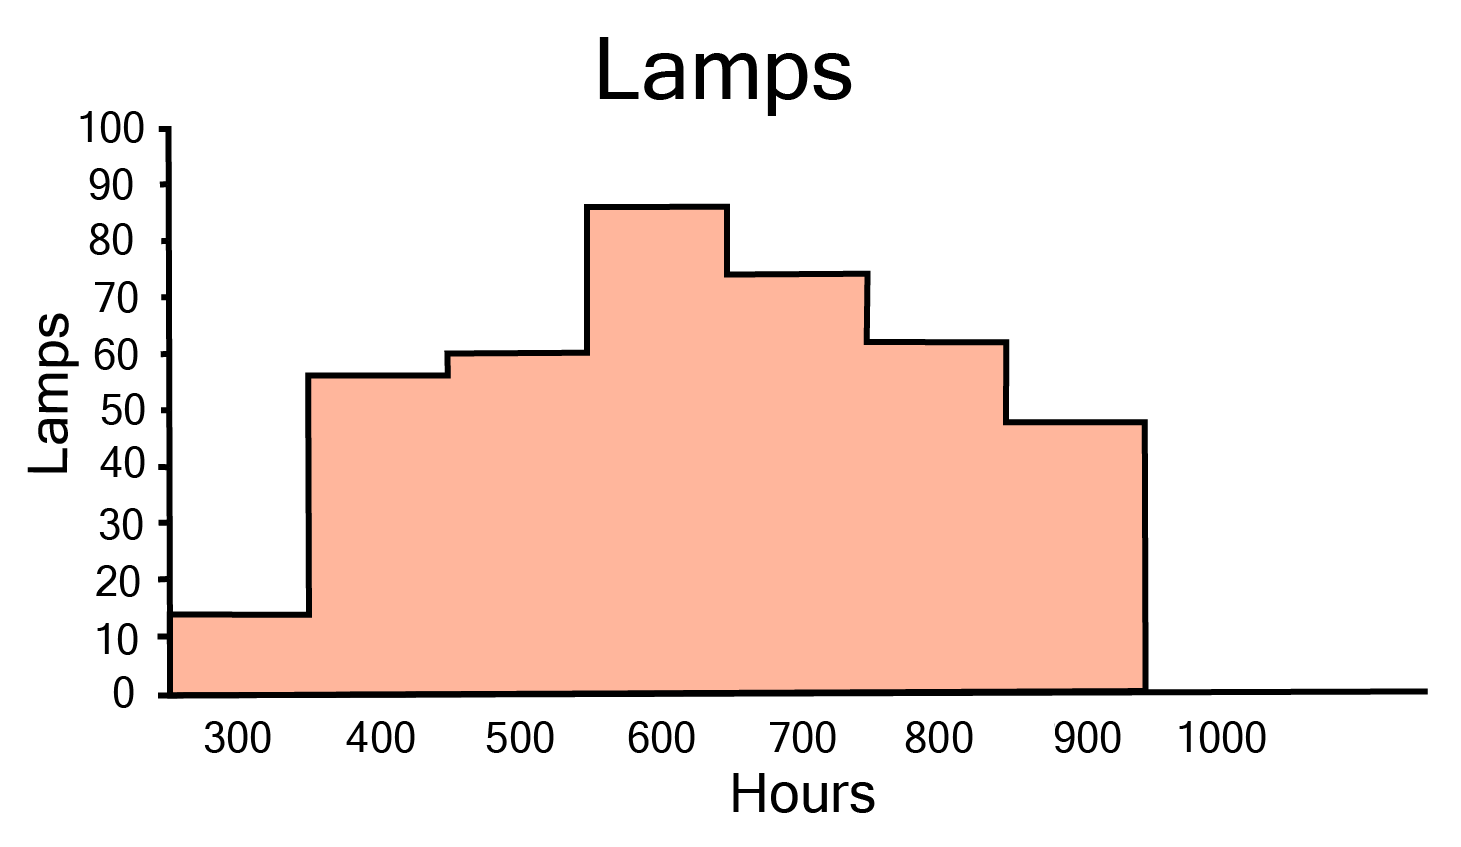
5. The following table gives the life times of neon lamps: 


Length (in Hours)

Number of Lamps

300 - 400

14

400 - 500

56

500 - 600

60

600 - 700

86

700 - 800

74

800 - 900

62

900 - 1000

48


i. Represent the given information with the help of a histogram.

Ans: The histogram of the given data may be produced by plotting the life duration (in hours) of neon lamps on the x-axis and the number of lamps on the y-axis. Here,1

Lamps


Here, 1 unit on the y-axis represents 10 lamps.


ii. How many lamps have a lifetime of more than \[700\] hours?

Ans: It may be deduced that the number of neon lamps with a lifetime more than \[700\]is equal to the sum of the numbers of neon lamps with lifetimes of \[700,800\]and \[900\]. As a result, there are \[184\] neon bulbs with a lifetime of more than \[700\] hours \[(74 + 62 + 48 = 184)\].


6. The following table gives the distribution of students of two sections according to the mark obtained by them:

Section A

Section B

Marks

Frequency 

Marks 

Frequency 

0-10

3

0-10

5

10-20

9

10-20

19

20-30

17

20-30

15

30-40

12

30-40

10

40-50

9

40-50

1


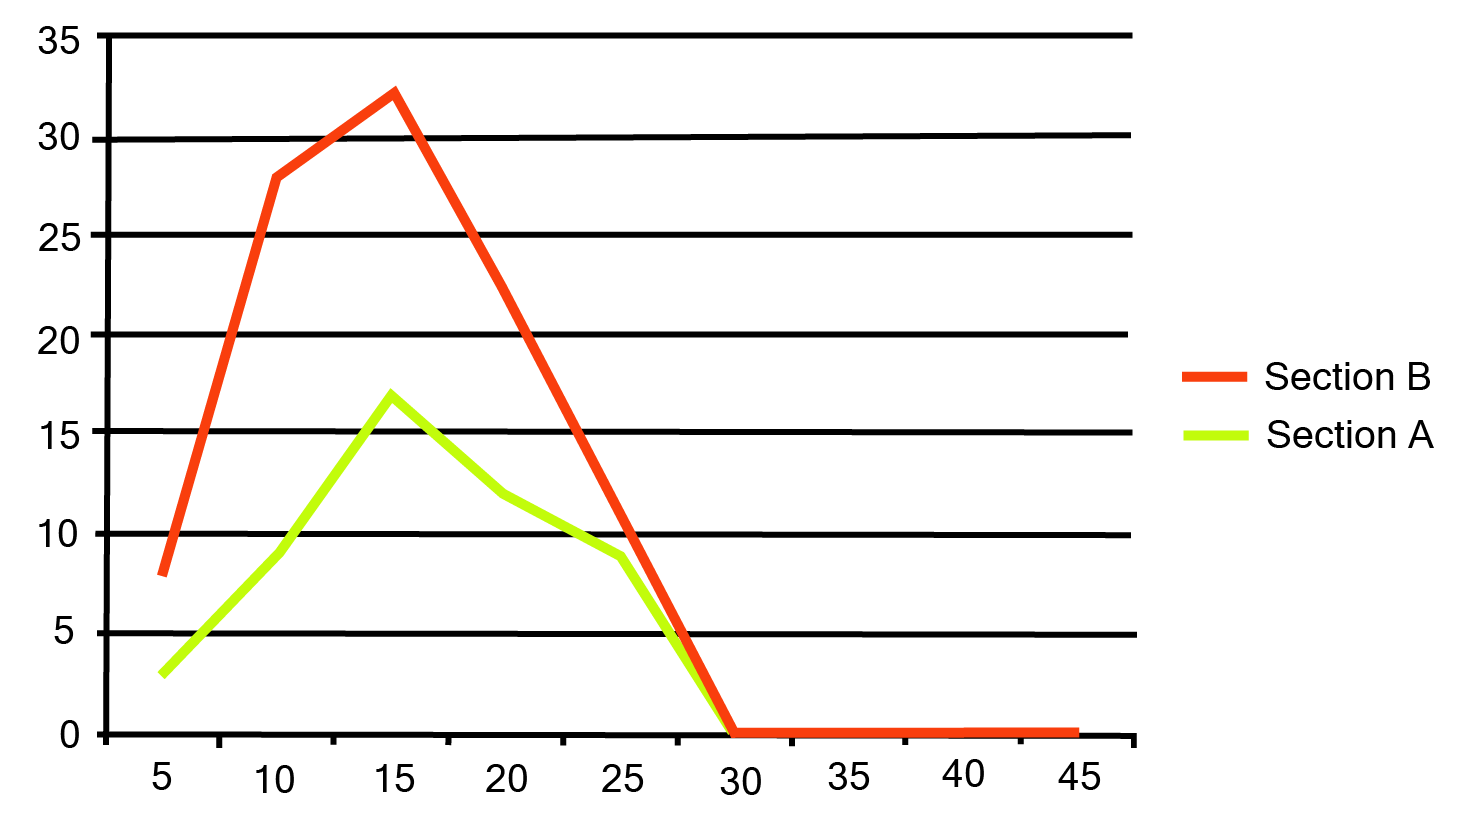
Represent the marks of the students of both the sections on the same graph by two frequency polygons. From the two polygons compare the performance of the two sections.

Ans: We can find the class marks of the given class intervals by using the following formula.

\[{\text{Class mark  = }}\dfrac{{{\text{Upper class limit  +  Lower class limit}}}}{2}\]

Section A

Section B

Marks

Class Marks

Frequency 

Marks 

Class Marks

Frequency 

0-10

5

3

0-10

5

5

10-20

15

9

10-20

15

19

20-30

25

17

20-30

25

15

30-40

35

12

30-40

35

10

40-50

45

9

40-50

45

1


The frequency polygon can be constructed as follows, with class markings on the x-axis and frequency on the y-axis, and an appropriate scale \[(1{\text{ unit  =  3 for the y - axis}})\].

The frequency polygon


It can be observed that the performance of students of section โ€˜Aโ€™ is better than the students of section โ€˜Bโ€™ in terms of good marks.


7. The runs scored by two teams A and B on the first 60 balls in a cricket match are given below:

Number of Balls

Team A

Team B

1-6

2

5

7-12

1

6

13-18

8

2

19-24

9

10

25-30

4

5

31-36

5

6

37-42

6

3

43-48

10

4

49-54

6

8

55-60

2

10


Represent the data of both the teams on the same graph by frequency polygons. 

(Hint: First make the class intervals continuous.)

Ans: As it can be seen data is not continuous, and the difference in upper limit and

lower limit is 1, so to make class interval continuous 0.5 needed to be added in each

limit.

Class Mark=$(\frac{\text{Upper Limit + Lower Limit} }{\text{2}})$


No. of Balls

Class Mark

Team A

Team B

0.5 - 6.5

3.5

2

5

6.5 - 12.5

9.5 

12.5 - 18.5 

15.5 

18.5 - 24.5 

21.5 

10 

24.5 - 30.5 

27.5 

30.5 - 36.5 

33.5 

36.5 - 42.5 

39.5 

42.5 - 48.5 

45.5 

10 

48.5 - 54.5 

51.5 

54.5 - 60.5 

57.5 

10 


A frequency polygon can be created by plotting class grades on the x-axis and running times on the y-axis.


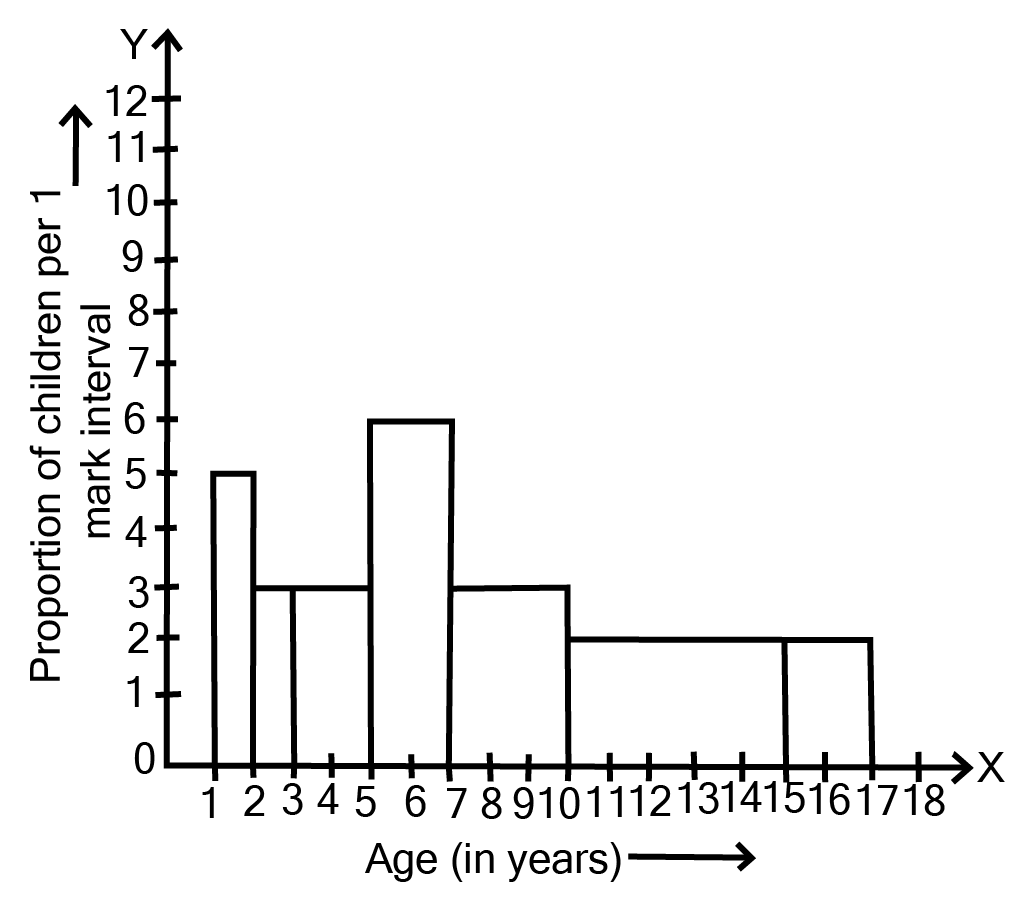
8. A random survey of the number of children of various age groups playing in park was found as follows:

Age (in years)

Number of Children

1-2

5

2-3

3

3-5

6

5-7

12

7-10

9

10-15

10

15-17

4


Draw a histogram to represent the data above.

Ans:

Age (in years)

Frequency (Number of Children)

Width of Class

Length of Rectangle

1-2

5

1

\[\dfrac{{5 \times 1}}{1} = 5\]

2-3

3

1

\[\dfrac{{3 \times 1}}{1} = 3\]

3-5

6

2

\[\dfrac{{6 \times 1}}{2} = 3\]

5-7

12

2

\[\dfrac{{12 \times 1}}{2} = 6\]

7-10

9

3

\[\dfrac{{9 \times 1}}{3} = 3\]

10-15

10

5

\[\dfrac{{10 \times 1}}{5} = 2\]

15-17

4

2

\[\dfrac{{4 \times 1}}{2} = 2\]


The number of children of various age groups playing in park


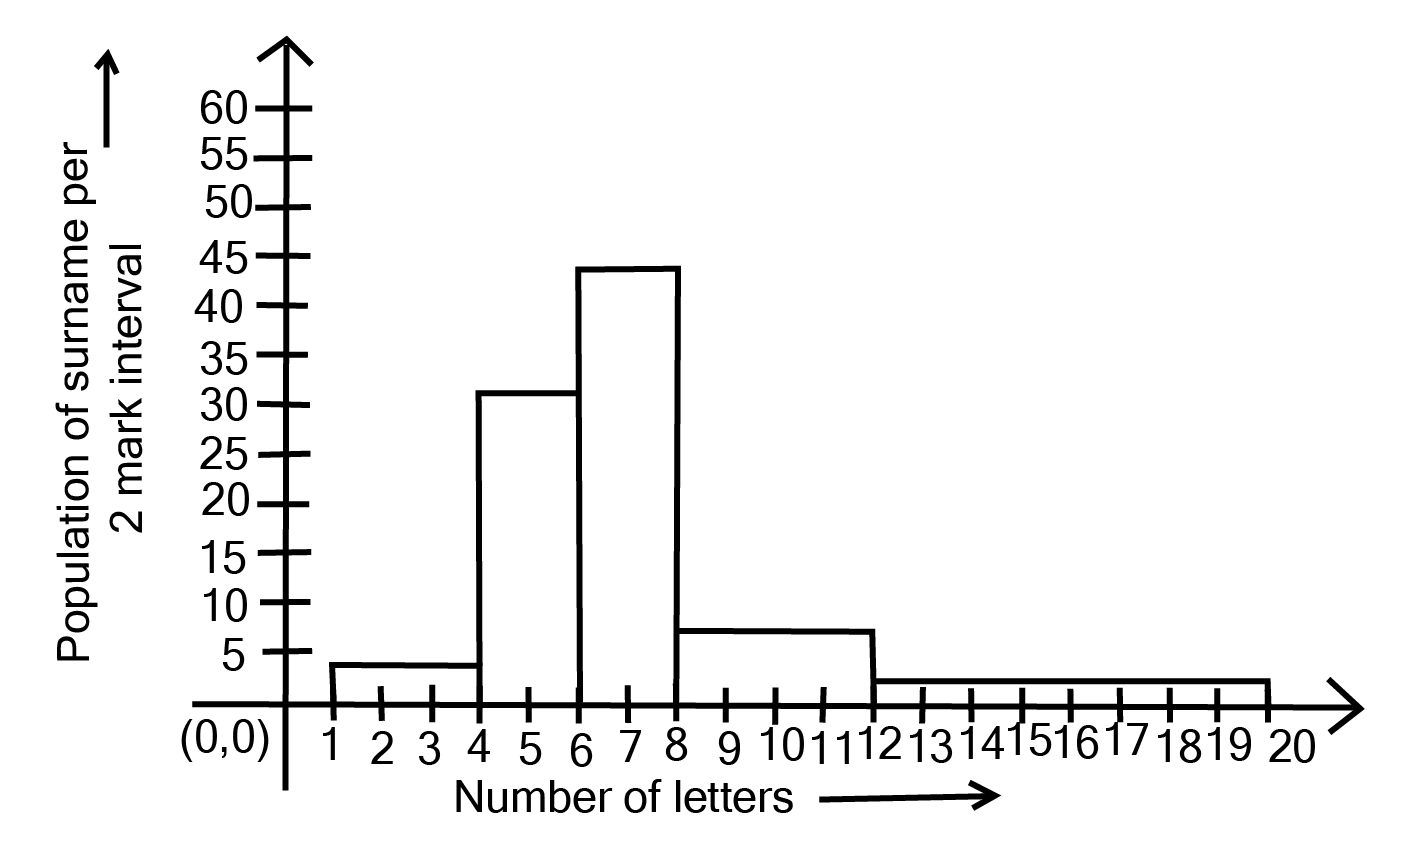
9. \[100\] surnames were randomly picked up from a local telephone directory and a frequency distribution of the number of letters in the English alphabet in the surnames was found as follows:


Number of Letters

Number of Surnames

1-4

4-6

6-8

8-12

12-20

6

30

44

16

4


i. Draw a histogram to depict the given information.

Ans:


Number of Letters

Frequency (Number of Surnames)

Width of Class

Length of Rectangle

1-4

6

3

\[\dfrac{{6 \times 2}}{3} = 4\]

4-6

30

2

\[\dfrac{{30 \times 2}}{2} = 30\]

6-8

44

2

\[\dfrac{{44 \times 2}}{2} = 44\]

8-12

16

4

\[\dfrac{{16 \times 2}}{4} = 8\]

12-20

4

8

\[\dfrac{{4 \times 2}}{8} = 1\]


The histogram can be generated using the number of letters on the x-axis and the fraction of the number of surnames per 2 letters interval on the y-axis, as well as an acceptable scale (1 unit = 4 students for the y axis).

The number of letters on the x-axis and the fraction of the number of surnames per 2 letters interval on the y-axis


ii. Write the class interval in which the maximum number of surnames lie.

Ans: The maximum number of surnames in the class interval is 6-8 since it contains 44 surnames, which is the maximum for this data.


Conclusion

NCERT Solutions for Statistics Class 9 Exercise 12.1 by Vedantu covers essential concepts such as data collection, organization, and interpretation, including measures of central tendency (mean, median, mode) and graphical representation of data (bar graphs, histograms, frequency polygons). Understanding these concepts is crucial as they form the foundation for more advanced statistical analysis in higher classes. Vedantu's solutions provide step-by-step explanations and practice problems, ensuring that students grasp these fundamental ideas effectively.


CBSE Class 9 Maths Chapter 12 Other Study Materials


Chapter-Specific NCERT Solutions for Class 9 Maths

Given below are the chapter-wise NCERT Solutions for Class 9 Maths. Go through these chapter-wise solutions to be thoroughly familiar with the concepts.


Important Study Materials for CBSE Class 9 Maths

FAQs on NCERT Solutions for Class 9 Maths Chapter 12 - Statistics Exercise 12.1

1. What is Statistics? Explain its Significance?

Statistics is one of the mathematical disciplines. It helps to organize the data. It analyzes and quantifies the data using different measures. It also helps to represent data in various forms and can draw conclusions from them.


Statistics play a vital role in all kinds of industries. Because, irrespective of the type of data, data is mandatory for firm's and it is important to analyze it. It has a great career too.

2. Define the Mean, Median, and Mode?

The basic statistical measures are mean, median, and mode. So to get enough knowledge, it is important to understand these three definitions and the difference between them.


Mean: The term means refers to average. Mean is defined as the average of the given set of data. We can calculate by dividing the sum of all values by several values.


Median: Simply, the middle term of the set is known as the median of the set. If it has an even number of terms in the set, the average of two middle terms is the median.


Mode: The highest repetitive term of the set is called the mode of the set.

3. Which chapter is Exercise 12.3 a part of?

Exercise 12.3 of Class 9 Maths is a part of the chapter on Statistics. It deals with the practice of collecting, analyzing, and surveying numerical data that are present in large proportions. Furthermore, it is the study of this data that includes gathering, reviewing, and ultimately arriving at a conclusion on the given data. You can get all the study resources related to the chapter on the Vedantu app and website.

4. What will students learn in NCERT Class 9 Maths Chapter 12 Exercise-12.3?

The NCERT Class 9 Maths Chapter 12 Exercise-12.3 help students decipher all the basic concepts, formulas, and equations related to Statistics. The sums in this exercise elucidate every concept from an applicational point-of-view, making it easier to understand for students. Moreover, there are solved examples that help students to get hold of the different question patterns asked in the examination.

5. How many sums are given in NCERT Class 9 Maths Chapter 12 Ex-12.3?

There are a total of 9 questions given in Class 9 Maths Chapter 12 Ex-12.3. The sums of this exercise require understanding and solving survey, data, and graph-related questions and practicing these with the help of graph plotting. The graphs are a pictorial representation of the statistical or functional relationships between variables and help in summarizing sets of data and give solutions for practical data. Practicing these sums will help students learn the basic concepts and techniques while working with graphs, which will help them in learning advanced mathematics as well.

6. Can I download NCERT Solutions for Class 9 Maths Chapter 12 Ex-12.3 PDF for free?

Yes, NCERT Solutions for Class 9 Maths Chapter 12 Ex-12.3 are available on Vedantu in the PDF format. Students can download the NCERT Solutions PDF for free from the Vedantu. Also, they can download the ebook of NCERT Class 9 Maths from Vedantu for their practice purpose. The solution PDF for NCERT Solutions Class 9 Maths Chapter 12 Exercise 12.3 can be downloaded for free of cost from the Vedantu website or mobile app. Students can also take a hard copy of the solutions PDF and refer to it for their practice.ย 

7. Are the sums in Chapter 12 Exercise 12.3 of Class 9 Maths easy to solve?

Students need to be thorough in their concepts before solving the sums of Chapter 12 Exercise 12.3 of Class 9 Maths. By solving the sums given in Exercise 12.3 students will be able to strengthen their understanding of the concepts. Also, with good practice, they will be able to solve the sums swiftly during the examination, and have ample amount of time to revise their solutions. Thus, it boosts their confidence during the examination and helps them solve questions without any doubt.

8. What topics are covered in Class 9 Maths 12.1 of Chapter 12 (Statistics) in NCERT?

Exercise 12.1 focuses on the graphical representation of data, particularly histograms, frequency polygons, and cumulative frequency graphs. These graphical methods are crucial for visually interpreting and analyzing data.

9. Why are graphical representations of data important in Class 9 Maths Chapter Statistics Exercise 12.1?

Graphical representations are important because they:

  • Provide a visual summary of data.

  • Make it easier to identify patterns, trends, and outliers.

  • Facilitate comparison between different data sets.

10. What types of questions are commonly asked in exams from Class 9th Maths Chapter 12 Exercise 12.1?

Commonly asked questions in exams from Exercise 12.1 of Class 9 Maths Statistics include:

  • Drawing and interpreting histograms.

  • Constructing and analyzing frequency polygons.

  • Creating and using cumulative frequency graphs (ogives).

  • Finding statistical measures like median using graphical methods.