


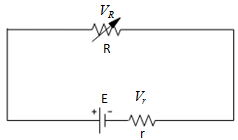
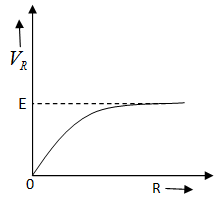
A cell having an emf E and an internal resistance r is connected across a variable external resistance R. As the resistance R increases, the plot of potential difference V across R is given by.
Answer
579.9k+ views
Hint: To obtain a plot of any two quantities, plug in the extreme values in the equation of their relation. Also, observe how the two quantities vary with respect to each other in the middle of the extreme values (analyzing the slope at different points).
Formula used:
$\sum\limits_{i=1}^{n}{{{V}_{i}}}=E$
${{V}_{R}}=\dfrac{E}{1+\dfrac{r}{R}}$
Complete step by step answer:
First let us obtain an expression between Potential difference across R i.e. ${{V}_{R}}$ and R
Before that let us understand Kirchhoff law,
Kirchhoff’s law: It states that the sum of the potential difference across the resistances connected to the cell or battery is equal to the emf of the cell i.e.
$\sum\limits_{i=1}^{n}{V_{i}^{{}}}=E$
n is the no of resistances connected across the cell
$V=iR$ where $i$ is the current in the circuit.
Applying Kirchhoff’s law we get to the above circuit diagram,
${{V}_{r}}+{{V}_{R}}=E$
$ir+iR=E$
Taking $i$ common we have,
$i(r+R)=E$
$i=\dfrac{E}{r+R}$
Let $i=\dfrac{E}{r+R}$ be equation (1) and ${{V}_{R}}=iR$ be equation (2)
Substituting 1 in equation 2 we get,
${{V}_{R}}=iR$
${{V}_{R}}=\dfrac{E}{r+R}R$
Simplifying further by taking R in the denominator,
${{V}_{R}}=\dfrac{E}{1+\dfrac{r}{R}}$
Analyzing the above equation
For R equals zero we have ${{V}_{R}}$$=0$. Hence the plot passes through origin.
For R very large value of R i.e. $\dfrac{r}{R}$ can be ignored and hence ${{V}_{R}}=E$
Now let us take R as multiple of r i.e.
If $r=R$ then ${{V}_{R}}=\dfrac{E}{2}$
$R=2r$ then ${{V}_{R}}=\dfrac{2E}{3}$
$R=3r$ then ${{V}_{R}}=\dfrac{3E}{4}$
$R=4r$ then ${{V}_{R}}=\dfrac{5E}{4}$ and so on
So if we observe the analysis, change in R with respect to change in ${{V}_{R}}$ is not constant, that is the slope keeps on changing and in fact it just keeps on decreasing. So the plot should be,
Note:
Analysis of the graph should be carried out in a systematic manner. Relating the equation to some general equation of line, curve and other helps to approach an answer easily. Hence knowledge of math is very important to understand graphs.
Recently Updated Pages
Master Class 12 Economics: Engaging Questions & Answers for Success
Master Class 12 Physics: Engaging Questions & Answers for Success
Master Class 12 English: Engaging Questions & Answers for Success
Master Class 12 Social Science: Engaging Questions & Answers for Success
Master Class 12 Maths: Engaging Questions & Answers for Success
Master Class 12 Business Studies: Engaging Questions & Answers for Success
Trending doubts
Which are the Top 10 Largest Countries of the World?
What are the major means of transport Explain each class 12 social science CBSE
Draw a labelled sketch of the human eye class 12 physics CBSE
Why cannot DNA pass through cell membranes class 12 biology CBSE
Differentiate between insitu conservation and exsitu class 12 biology CBSE
Draw a neat and well labeled diagram of TS of ovary class 12 biology CBSE