


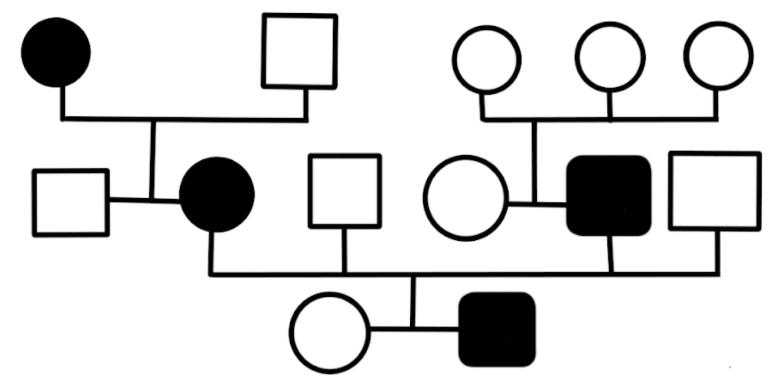
Above pedigree chart show
A. Autosomal dominant trait
B. Sex-linked recessive trait
C. Autosomal recessive trait
D. Sex-linked dominant trait
Answer
566.7k+ views
Hint: A pedigree is a systematic listing (either as words or symbols) of the ancestors of a given individual, or it may be the "family tree" for a number of individuals. In these charts, females are represented as circles and males as squares.
Complete Answer:
- In this pedigree chart Mating is shown as horizontal lines between two individuals. The offspring of a mating are connected by vertical line to the mating line. Different shades or colours added to the symbols can represent various phenotypes.
- In the above given pedigree chart, it can be seen that affected individuals are found in every generation which means it’s a dominant trait because recessive traits occur in alternate generations only. So it can be concluded that affected individuals are due to the dominant allele of a particular trait present in them.
- It also shows that the male and female are equally affected at every generation which means it is autosomal trait because sex-linked affects particular sex only.
The correct option is (A) i.e. autosomal dominant trait.
Note: In human beings pedigree analysis is used to know the transmission of specific traits because of following reasons:
- Mating cannot be controlled. To set up controlled mating experiments are not ethical or feasible.
- Generation time is long in human beings, so it takes a long time to track inheritance of traits over more than one generation.
- The total number of offspring per mating is limited, so phenotypic ratios are uncertain.
Recently Updated Pages
Master Class 12 Economics: Engaging Questions & Answers for Success
Master Class 12 Physics: Engaging Questions & Answers for Success
Master Class 12 English: Engaging Questions & Answers for Success
Master Class 12 Social Science: Engaging Questions & Answers for Success
Master Class 12 Maths: Engaging Questions & Answers for Success
Master Class 12 Business Studies: Engaging Questions & Answers for Success
Trending doubts
Why cannot DNA pass through cell membranes class 12 biology CBSE
Draw a neat and well labeled diagram of TS of ovary class 12 biology CBSE
In a human foetus the limbs and digits develop after class 12 biology CBSE
AABbCc genotype forms how many types of gametes a 4 class 12 biology CBSE
Differentiate between homogeneous and heterogeneous class 12 chemistry CBSE
The correct structure of ethylenediaminetetraacetic class 12 chemistry CBSE