


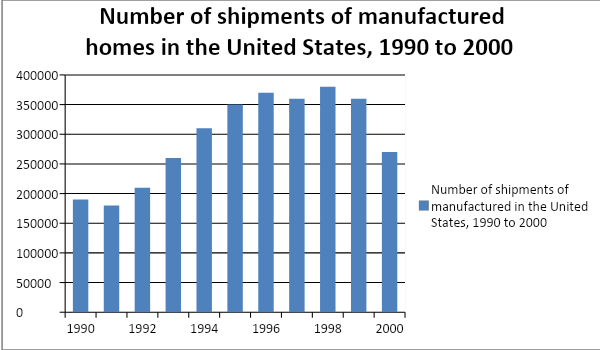
According to the chart shown which of the following is closest to the median annual number of shipments of manufactured homes in the United States for the years from 1990 to 2000 inclusive.
A.250000
B.280000
C.310000
D.325000
E.340000
Answer
573.6k+ views
Hint: We will arrange the data in ascending/descending order and calculate which value will be the median of the data. We will find that value and find the corresponding year from the graph. We will choose the correct option accordingly.
Formulas used:
In a series of data that has \[n\] observations, the median value is the \[{\left( {\dfrac{{n + 1}}{2}} \right)^{th}}\] term if the number of observations is odd. If the number of observations is even, then the median is the average of the \[{\left( {\dfrac{n}{2}} \right)^{th}}\] and \[{\left( {\dfrac{n}{2} + 1} \right)^{th}}\] term
Complete step-by-step answer:
Median is a frequently used to measure the centre of data. It is that number that equally divides the data into a top or upper half and a bottom or lower half. We will arrange the data in ascending order. To do so, we will look at the height of each bar and arrange the observations such that the year with the shortest bar height is written first and the year with the longest bar height is written last:
1991, 1990, 1992, 2000, 1993, 1994, 1995, 1999, 1997, 1996 and 1998.
We can see that there are 11 observations in the data set. 11 is an odd number. We will substitute 11 for \[n\] in the formula to find the median value term:
\[\begin{array}{l} \Rightarrow \dfrac{{11 + 1}}{2} = \dfrac{{12}}{2}\\ \Rightarrow {6^{th}}{\rm{ term}}\end{array}\]
So, the median will be the 6th observation of the ordered data which is the number of shipments manufactured homes in the United States in the year 1994.
340000 is the required median annual number of shipments.
$\therefore $ Option E is the correct option.
Note: We might make a mistake by not arranging the data in increasing or decreasing order before selecting the median. If we do not arrange the date then we will get the wrong median. We know that the formula of the median is different for odd and even numbers of observation. So it becomes necessary to count the total number of the observations of the given data. If we don’t count the total number of observations then we might use the wrong formula and at end get the wrong median.

Recently Updated Pages
Master Class 9 General Knowledge: Engaging Questions & Answers for Success
Master Class 9 Social Science: Engaging Questions & Answers for Success
Master Class 9 English: Engaging Questions & Answers for Success
Master Class 9 Maths: Engaging Questions & Answers for Success
Master Class 9 Science: Engaging Questions & Answers for Success
Class 9 Question and Answer - Your Ultimate Solutions Guide
Trending doubts
Difference Between Plant Cell and Animal Cell
Fill the blanks with the suitable prepositions 1 The class 9 english CBSE
Who is eligible for RTE class 9 social science CBSE
Which places in India experience sunrise first and class 9 social science CBSE
What is pollution? How many types of pollution? Define it
Name 10 Living and Non living things class 9 biology CBSE