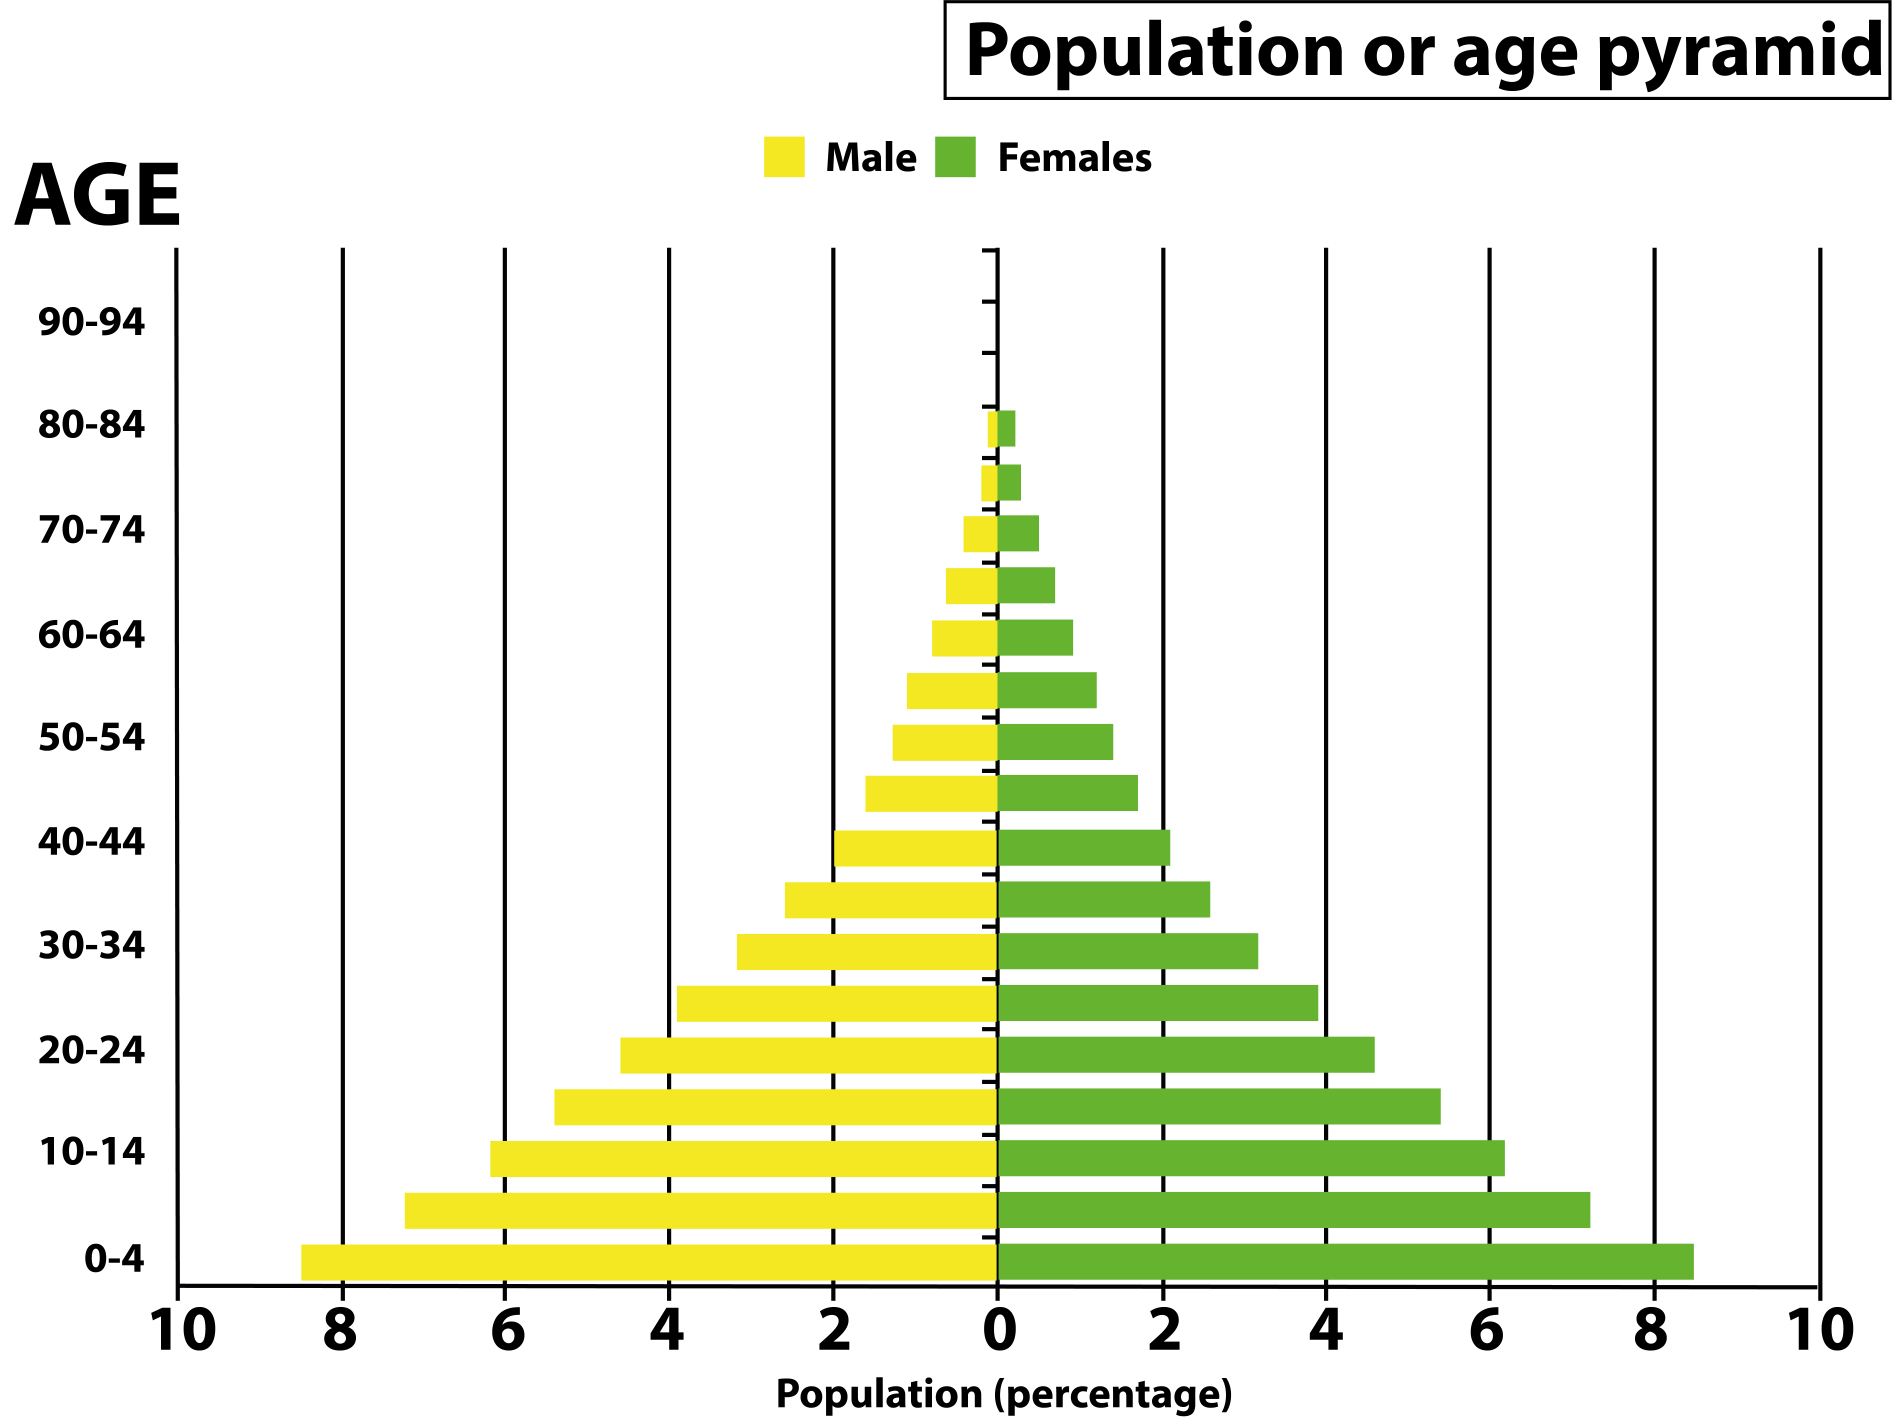
What are age pyramids? Name different types of age pyramids.
Answer
523.7k+ views
Hint:Age pyramids are also known as population pyramids or age-gender pyramids. The distribution of organisms is made by observing certain characteristics and the resultant figure so obtained is in the form of a pyramid.
Complete answer:
A population pyramid is also known as an "age-gender-pyramid". It is a graphical illustration that shows the distribution of varied age groups in a population that forms the figure or shape of a pyramid when the population is growing.
Males are conventionally shown on the left and females on the right side., and that they could also be measured by the raw number or as a percentage of the entire population. This tool is often used to visualize the age of a selected population.
It is also utilized in ecology to work out the general age distribution of a population; a sign of the reproductive capabilities and likelihood of the continuation of a species.

There are three types of age pyramids present which were divided based on fertility and mortality rates of a country. They are as follows-
- Stationary" pyramid: The percentage of the population in this condition generally remains the same throughout the time period. It means that the death rate and birth rates are equal.
- Expansive pyramid: Expansive population pyramids depict populations that have a bigger percentage of individuals in younger age groups. Populations that come under these have high fertility rates with lower life expectancies.
- Constrictive pyramids: Constrictive population pyramids are named so because they're constructed at the bottom. there's a lower percentage of younger people. There are declining birth rates since each succeeding age group is getting smaller and smaller.
Note: Many of us get confused between the population pyramid i.e age- sex pyramid and ecological pyramids. An ecological pyramid is a method in which the relationship between different organisms in an ecosystem is represented graphically. Each of the bars that make up the ecological pyramid is based on who eats whom.
Complete answer:
A population pyramid is also known as an "age-gender-pyramid". It is a graphical illustration that shows the distribution of varied age groups in a population that forms the figure or shape of a pyramid when the population is growing.
Males are conventionally shown on the left and females on the right side., and that they could also be measured by the raw number or as a percentage of the entire population. This tool is often used to visualize the age of a selected population.
It is also utilized in ecology to work out the general age distribution of a population; a sign of the reproductive capabilities and likelihood of the continuation of a species.

There are three types of age pyramids present which were divided based on fertility and mortality rates of a country. They are as follows-
- Stationary" pyramid: The percentage of the population in this condition generally remains the same throughout the time period. It means that the death rate and birth rates are equal.
- Expansive pyramid: Expansive population pyramids depict populations that have a bigger percentage of individuals in younger age groups. Populations that come under these have high fertility rates with lower life expectancies.
- Constrictive pyramids: Constrictive population pyramids are named so because they're constructed at the bottom. there's a lower percentage of younger people. There are declining birth rates since each succeeding age group is getting smaller and smaller.
Note: Many of us get confused between the population pyramid i.e age- sex pyramid and ecological pyramids. An ecological pyramid is a method in which the relationship between different organisms in an ecosystem is represented graphically. Each of the bars that make up the ecological pyramid is based on who eats whom.
Recently Updated Pages
Master Class 12 Economics: Engaging Questions & Answers for Success

Master Class 12 Physics: Engaging Questions & Answers for Success

Master Class 12 English: Engaging Questions & Answers for Success

Master Class 12 Social Science: Engaging Questions & Answers for Success

Master Class 12 Maths: Engaging Questions & Answers for Success

Master Class 12 Business Studies: Engaging Questions & Answers for Success

Trending doubts
Why cannot DNA pass through cell membranes class 12 biology CBSE

Differentiate between insitu conservation and exsitu class 12 biology CBSE

Draw a neat and well labeled diagram of TS of ovary class 12 biology CBSE

In a human foetus the limbs and digits develop after class 12 biology CBSE

AABbCc genotype forms how many types of gametes a 4 class 12 biology CBSE

The correct structure of ethylenediaminetetraacetic class 12 chemistry CBSE


