


Consider a thin spherical shell of radius R with its center at the origin, carrying uniform positive surface charge density. The variation of the magnitude of the electric field and the electric potential V(r) with the distance r from the center, is best represented by which graph.

Answer
574.5k+ views
Hint: We are given a spherical shell with radius R and centre at origin which carries a uniform positive surface charge density. We are given four plots that represent the electric field and electric potential at a distance r from the centre. The dashed lines in the plots show the electric potential and the solid lines show the electric field. By finding the relation between electric potential and r and also the relation between electric field and r we can find the correct plot.
Complete step by step answer:
In the question it is said that there is a thin spherical shell with radius ‘R’ and centre at origin and it carries a uniform positive surface charge density.
The figure given below shows us the given situation.
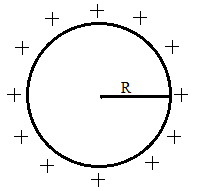
If we consider a Gaussian sphere inside the given spherical sphere, there is no charge enclosed inside the Gaussian sphere.
Therefore we can say that the electric field inside the sphere is zero.
We know that when there is no electric field, the electric potential will be constant.
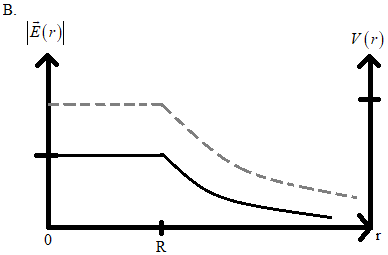
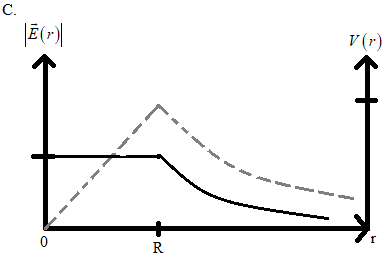
In the given four graphs, if we consider the first and third graph, we can see that the electric potential (dashed lines) is gradually increasing in them and when we consider the second and fourth graph we can see that the electric potential (dashed lines) is constant in them.
Therefore we can eliminate the options A and C.
Now let us consider the outside region of the spherical shell.
We know that the electric field outside the sphere is inversely proportional to the square of distance to the point and the electric potential is inversely proportional to the distance, i.e.
$E\propto \dfrac{1}{{{r}^{2}}}$
$V\propto \dfrac{1}{r}$
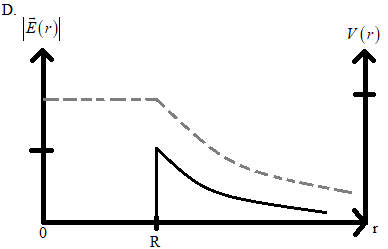
From this we can understand that, when we plot the graph between electric field E and r, the curve will sharply decrease and the curve of electric potential and r will gradually decrease.
Hence the best plot for the given situation is,
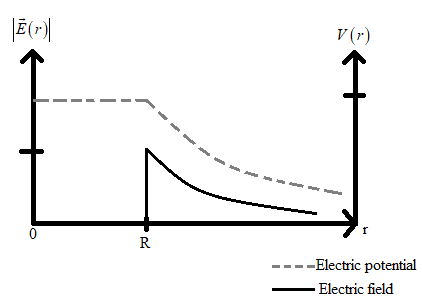
Therefore the correct answer is option D.
Note:
Electric field is an imaginary region of space around a charged particle. It is mathematically defined as the force per unit charge.
Electric potential is simply the amount of word required to bring a unit charge from a reference point to another point against the electric field.
Gauss’s law states that the net electric flux through a hypothetical closed surface (also known as a Gaussian surface) will be equal to $\dfrac{1}{{{\varepsilon }_{0}}}$ times the charge enclosed in that surface.
Complete step by step answer:
In the question it is said that there is a thin spherical shell with radius ‘R’ and centre at origin and it carries a uniform positive surface charge density.
The figure given below shows us the given situation.
If we consider a Gaussian sphere inside the given spherical sphere, there is no charge enclosed inside the Gaussian sphere.
Therefore we can say that the electric field inside the sphere is zero.
We know that when there is no electric field, the electric potential will be constant.
In the given four graphs, if we consider the first and third graph, we can see that the electric potential (dashed lines) is gradually increasing in them and when we consider the second and fourth graph we can see that the electric potential (dashed lines) is constant in them.
Therefore we can eliminate the options A and C.
Now let us consider the outside region of the spherical shell.
We know that the electric field outside the sphere is inversely proportional to the square of distance to the point and the electric potential is inversely proportional to the distance, i.e.
$E\propto \dfrac{1}{{{r}^{2}}}$
$V\propto \dfrac{1}{r}$
From this we can understand that, when we plot the graph between electric field E and r, the curve will sharply decrease and the curve of electric potential and r will gradually decrease.
Hence the best plot for the given situation is,
Therefore the correct answer is option D.
Note:
Electric field is an imaginary region of space around a charged particle. It is mathematically defined as the force per unit charge.
Electric potential is simply the amount of word required to bring a unit charge from a reference point to another point against the electric field.
Gauss’s law states that the net electric flux through a hypothetical closed surface (also known as a Gaussian surface) will be equal to $\dfrac{1}{{{\varepsilon }_{0}}}$ times the charge enclosed in that surface.
Recently Updated Pages
Master Class 12 Economics: Engaging Questions & Answers for Success
Master Class 12 Physics: Engaging Questions & Answers for Success
Master Class 12 English: Engaging Questions & Answers for Success
Master Class 12 Social Science: Engaging Questions & Answers for Success
Master Class 12 Maths: Engaging Questions & Answers for Success
Master Class 12 Business Studies: Engaging Questions & Answers for Success
Trending doubts
Which are the Top 10 Largest Countries of the World?
What are the major means of transport Explain each class 12 social science CBSE
Draw a labelled sketch of the human eye class 12 physics CBSE
Why cannot DNA pass through cell membranes class 12 biology CBSE
Differentiate between insitu conservation and exsitu class 12 biology CBSE
Draw a neat and well labeled diagram of TS of ovary class 12 biology CBSE