


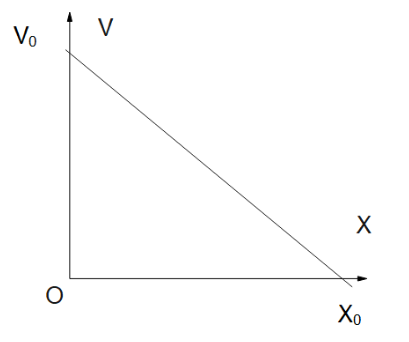
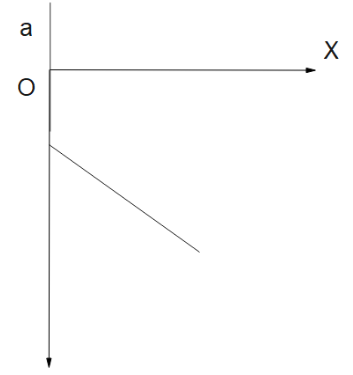
Depict the shown v-x graph in a-x graph
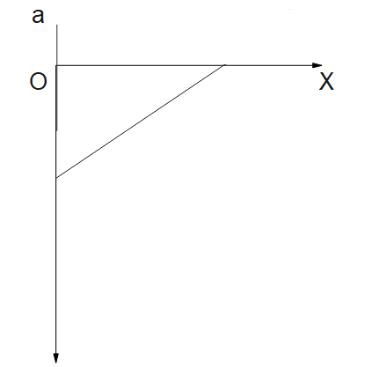
A.
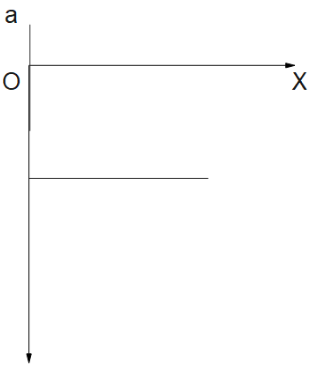
B.
C.
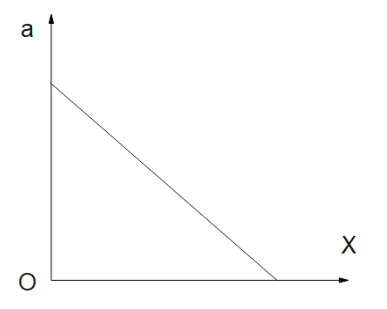
D.
Answer
502.2k+ views
Hint:To solve this question, we will use the basic formulas of acceleration and velocity and the understanding of curves and slope of a curve. Note that to solve questions of these types, the concepts of integration and differentiation related to curves are very important.
Complete answer:
From the given curve we can interpret the following things:
-The slope of the curve is negative.
-When the body is at origin, velocity is zero.
-When the body is at a distance of ${x_0}$ , the velocity is zero.
To construct the graph, let us link the two, acceleration and velocity:
Point 1. We know, acceleration $a = v\dfrac{{dv}}{{dx}}$ , where $v$ is the velocity and $\dfrac{{dv}}{{dx}}$ is the rate of change of velocity with distance. We see from the curve that $\dfrac{{dv}}{{dx}}$ is negative, thus stating that the value of acceleration is negative.Hence we get the first idea of the graph here.
Point2. Now also note that the velocity is falling in the given graph, thus there is a negative acceleration in the system and this is not constant.
Thus from our derived conditions, we can clearly state that options A and B satisfy Point 1.And by the Point 2. We can verify that only one graph supports our derivation: Option A.
Hence option A is the answer.
Note:Students often make mistakes in determining the value of slope, as they can consider the slope of the v-x graph positive and end up choosing option C as answer. It is also important to note that if the change of velocity with research to time was linear, only then would the acceleration be linear. Students often get confused between v-x and v-t graphs.
Recently Updated Pages
Master Class 11 Computer Science: Engaging Questions & Answers for Success
Master Class 11 Business Studies: Engaging Questions & Answers for Success
Master Class 11 Economics: Engaging Questions & Answers for Success
Master Class 11 English: Engaging Questions & Answers for Success
Master Class 11 Maths: Engaging Questions & Answers for Success
Master Class 11 Biology: Engaging Questions & Answers for Success
Trending doubts
One Metric ton is equal to kg A 10000 B 1000 C 100 class 11 physics CBSE
There are 720 permutations of the digits 1 2 3 4 5 class 11 maths CBSE
Discuss the various forms of bacteria class 11 biology CBSE
Draw a diagram of a plant cell and label at least eight class 11 biology CBSE
State the laws of reflection of light
Explain zero factorial class 11 maths CBSE