


Determine the angle of minimum deviation for a given prism by plotting a graph between the angle of incidence and angle of deviation.
Answer
525k+ views
Hint: The refractive index can be found by taking the ratio of the sine of half of the sum of the angle of prism and angle of minimum deviation to the sine of the half of the angle of prism. Using this find the procedure to find the angle of minimum deviation and plot the graph.
Complete step by step answer:
Goal: to calculate the minimum deviation angle for a prism by plotting a graph between the angle of incidence and angle of deviation.
Theory: Refraction happens if a light ray travels from one medium to another which is resulting in the deviation of the emergent ray from that of the incident ray. The refractive index of the material used in the prism can be shown as,
$n=\dfrac{\sin \left( \dfrac{A+{{\delta }_{m}}}{2} \right)}{\sin \left( \dfrac{A}{2} \right)}$
Where${{\delta }_{m}}$be the angle of minimum deviation and $A$ is the angle of the prism.
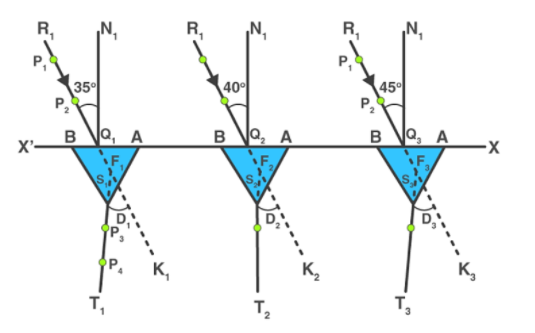
Procedure: keep the white sheet of paper on a drawing board and place it with the help of drawing pins. $X{X}'$ be the straight line which has been drawn parallel to the length of the paper such that it is in the middle of the paper. Mark the points ${{Q}_{1}},{{Q}_{2}},{{Q}_{3}}...$on the straight line $X{X}'$each at a distance of $5cm$. \[N{{Q}_{1}},N{{Q}_{2}}...\] are the normal that are figured on${{Q}_{1}},{{Q}_{2}},{{Q}_{3}}...$. Create the angles of \[35{}^\circ ,40{}^\circ ....60{}^\circ \] by making straight lines\[{{R}_{1}}{{Q}_{1}},{{R}_{2}}{{Q}_{2}}....\] with respect to this normals. In order to take one edge of the prism for all the observation, consider one corner of the prism as A. fix the prism with its refracting face AB on the line $X{X}'$ and on the point\[{{Q}_{1}}\] and also in the centre of AB. And also mark the boundary of the prism. On the line \[{{R}_{1}}{{Q}_{1}}\], place pins vertically and mark them as \[{{P}_{1}}\] and \[{{P}_{2}}\]. The distance between these pins must not be smaller than \[10mm\]. Look for the images of the points\[{{P}_{1}}\] and \[{{P}_{2}}\], through the prism face, AC. Close our left eye and keep the right eye open, bring the two images in a line. Place the other two pins vertically and name them as\[{{P}_{3}}\text{ and }{{P}_{4}}\]. These pins must be \[10cm\] apart from each other.\[{{P}_{3}}\text{ and }{{P}_{4}}\] must be in one straight with respect to the images of \[{{P}_{1}}\] and \[{{P}_{2}}\]. Mark the pricks of pins\[{{P}_{3}}\text{ and }{{P}_{4}}\]. Repeat the steps 7 to 13 for the rest of the points for angle \[40{}^\circ ,45{}^\circ .....60{}^\circ \].
Observation: the angle of prism $A=60{}^\circ $
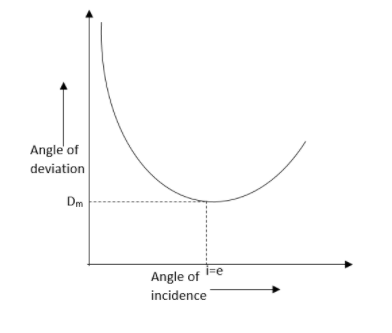
The graph can be plotted like this,
Result: the angle of minimum deviation is found. The graph has been plotted.
Note: This graph represents that the angle of incidence increases, the angle of deviation decreases first to attain the minimum value of ${{\delta }_{m}}$and then increases as the angle of incidence increases.
Complete step by step answer:
Goal: to calculate the minimum deviation angle for a prism by plotting a graph between the angle of incidence and angle of deviation.
Theory: Refraction happens if a light ray travels from one medium to another which is resulting in the deviation of the emergent ray from that of the incident ray. The refractive index of the material used in the prism can be shown as,
$n=\dfrac{\sin \left( \dfrac{A+{{\delta }_{m}}}{2} \right)}{\sin \left( \dfrac{A}{2} \right)}$
Where${{\delta }_{m}}$be the angle of minimum deviation and $A$ is the angle of the prism.
Procedure: keep the white sheet of paper on a drawing board and place it with the help of drawing pins. $X{X}'$ be the straight line which has been drawn parallel to the length of the paper such that it is in the middle of the paper. Mark the points ${{Q}_{1}},{{Q}_{2}},{{Q}_{3}}...$on the straight line $X{X}'$each at a distance of $5cm$. \[N{{Q}_{1}},N{{Q}_{2}}...\] are the normal that are figured on${{Q}_{1}},{{Q}_{2}},{{Q}_{3}}...$. Create the angles of \[35{}^\circ ,40{}^\circ ....60{}^\circ \] by making straight lines\[{{R}_{1}}{{Q}_{1}},{{R}_{2}}{{Q}_{2}}....\] with respect to this normals. In order to take one edge of the prism for all the observation, consider one corner of the prism as A. fix the prism with its refracting face AB on the line $X{X}'$ and on the point\[{{Q}_{1}}\] and also in the centre of AB. And also mark the boundary of the prism. On the line \[{{R}_{1}}{{Q}_{1}}\], place pins vertically and mark them as \[{{P}_{1}}\] and \[{{P}_{2}}\]. The distance between these pins must not be smaller than \[10mm\]. Look for the images of the points\[{{P}_{1}}\] and \[{{P}_{2}}\], through the prism face, AC. Close our left eye and keep the right eye open, bring the two images in a line. Place the other two pins vertically and name them as\[{{P}_{3}}\text{ and }{{P}_{4}}\]. These pins must be \[10cm\] apart from each other.\[{{P}_{3}}\text{ and }{{P}_{4}}\] must be in one straight with respect to the images of \[{{P}_{1}}\] and \[{{P}_{2}}\]. Mark the pricks of pins\[{{P}_{3}}\text{ and }{{P}_{4}}\]. Repeat the steps 7 to 13 for the rest of the points for angle \[40{}^\circ ,45{}^\circ .....60{}^\circ \].
Observation: the angle of prism $A=60{}^\circ $
| Serial no. | Angle of incidence$\left( {}^\circ \right)$ | Angle of deviation$\left( {}^\circ \right)$ |
| 1 | $35$ | $10$ |
| 2 | $40$ | $20$ |
| 3 | $45$ | $30$ |
| 4 | $50$ | $40$ |
| 5 | $55$ | $50$ |
| 6 | $60$ | $60$ |
The graph can be plotted like this,
Result: the angle of minimum deviation is found. The graph has been plotted.
Note: This graph represents that the angle of incidence increases, the angle of deviation decreases first to attain the minimum value of ${{\delta }_{m}}$and then increases as the angle of incidence increases.
Recently Updated Pages
Master Class 12 Economics: Engaging Questions & Answers for Success
Master Class 12 Physics: Engaging Questions & Answers for Success
Master Class 12 English: Engaging Questions & Answers for Success
Master Class 12 Social Science: Engaging Questions & Answers for Success
Master Class 12 Maths: Engaging Questions & Answers for Success
Master Class 12 Business Studies: Engaging Questions & Answers for Success
Trending doubts
Which are the Top 10 Largest Countries of the World?
What are the major means of transport Explain each class 12 social science CBSE
Draw a labelled sketch of the human eye class 12 physics CBSE
Why cannot DNA pass through cell membranes class 12 biology CBSE
Differentiate between insitu conservation and exsitu class 12 biology CBSE
Draw a neat and well labeled diagram of TS of ovary class 12 biology CBSE