


How do you determine the density from a graph of volume and mass ?
Answer
545.4k+ views
Hint: Since the slope of the line through mass on the y axis and volume on the x axis.
Density is Mass concluded VolumeD=$\dfrac{M}{V}$
Slope =$\dfrac{ y}{x}$
So uncertainty you graph Mass =y and Volume = x
The Slope is the usual Density
This is a great technique of defining Density
Complete step by step answer:
A mass versus volume graph has mass, typically in grams or kilograms, on the y-axis, which is the vertical axis, and volume on the x-axis, which is the horizontal access.
You can use this graph to figure out how much mass is in any specified volume of a substance. By means of the x-axis, localize the volume you're speculating about, then find the y-intercept and use the y-axis to find how much mass there is in that much volume. For example, if we had an example of a volume of six cubic centimeters, founded on the mass versus volume graph,.
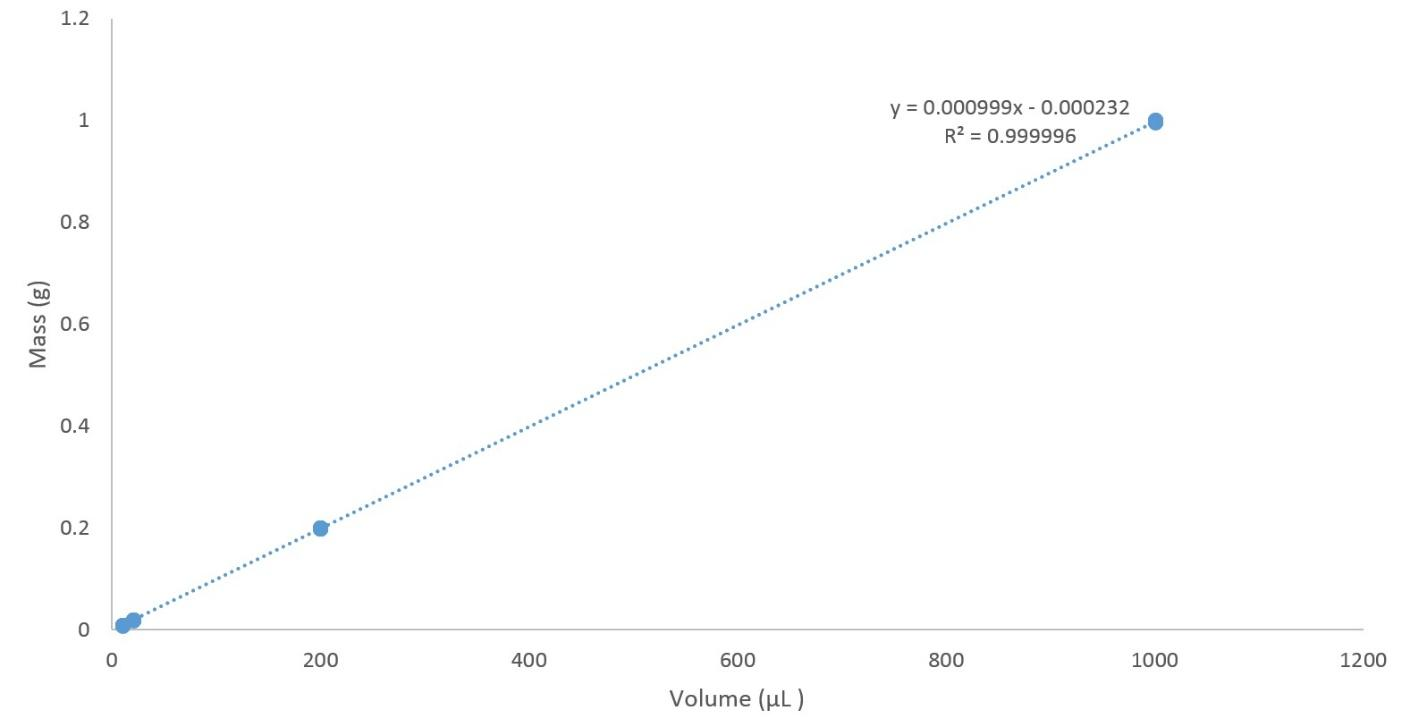
The formula meant for the slope of a straight line is the change in y divided by the change in x. Then the y axis is equal to mass, and the x axis is equal to volume, slope is equal to mass separated by volume. Then, the slope of a mass versus volume graph is equal to density.
Comparing Density
Since slope is equal to density, just glancing at a mass as against a volume graph can sometimes benefit you to recognize which of the two substances has a greater density.
Note: A steeper line specifies a greater slope and therefore a greater density. So, either substance has a steeper line or has a greater density. You can similarly practice the intentions we just discussed to invent the density of a substance.
Density is Mass concluded VolumeD=$\dfrac{M}{V}$
Slope =$\dfrac{ y}{x}$
So uncertainty you graph Mass =y and Volume = x
The Slope is the usual Density
This is a great technique of defining Density
Complete step by step answer:
A mass versus volume graph has mass, typically in grams or kilograms, on the y-axis, which is the vertical axis, and volume on the x-axis, which is the horizontal access.
You can use this graph to figure out how much mass is in any specified volume of a substance. By means of the x-axis, localize the volume you're speculating about, then find the y-intercept and use the y-axis to find how much mass there is in that much volume. For example, if we had an example of a volume of six cubic centimeters, founded on the mass versus volume graph,.
The formula meant for the slope of a straight line is the change in y divided by the change in x. Then the y axis is equal to mass, and the x axis is equal to volume, slope is equal to mass separated by volume. Then, the slope of a mass versus volume graph is equal to density.
Comparing Density
Since slope is equal to density, just glancing at a mass as against a volume graph can sometimes benefit you to recognize which of the two substances has a greater density.
Note: A steeper line specifies a greater slope and therefore a greater density. So, either substance has a steeper line or has a greater density. You can similarly practice the intentions we just discussed to invent the density of a substance.
Recently Updated Pages
Master Class 11 Computer Science: Engaging Questions & Answers for Success
Master Class 11 Business Studies: Engaging Questions & Answers for Success
Master Class 11 Economics: Engaging Questions & Answers for Success
Master Class 11 English: Engaging Questions & Answers for Success
Master Class 11 Maths: Engaging Questions & Answers for Success
Master Class 11 Biology: Engaging Questions & Answers for Success
Trending doubts
One Metric ton is equal to kg A 10000 B 1000 C 100 class 11 physics CBSE
There are 720 permutations of the digits 1 2 3 4 5 class 11 maths CBSE
Discuss the various forms of bacteria class 11 biology CBSE
Draw a diagram of a plant cell and label at least eight class 11 biology CBSE
State the laws of reflection of light
Explain zero factorial class 11 maths CBSE