


What is the domain of the graphed function?

$\begin{align}
& \left( A \right)y\ge 4 \\
& \left( B \right)x\ge -2 \\
& \left( C \right)y\ge -2 \\
& \left( D \right)x\le -2 \\
\end{align}$
Answer
529.2k+ views
Hint: The domain of any function is the set of real numbers that can be given to any function to operate. This set cannot contain any number where the function is discontinuous or undefined. The function also gives output (or, range) corresponding to this definite set of numbers only. The domain of any graph is the collection of all the points of its projection on the X-axis.
Complete step by step answer:
We have been given the graphical representation of a function in the problem. So, in order to find the domain of the given graphical representation, we will find all the points of projection of the graph on the X-axis and collect them all in a set.
Let us draw the diagram of the function as follows:
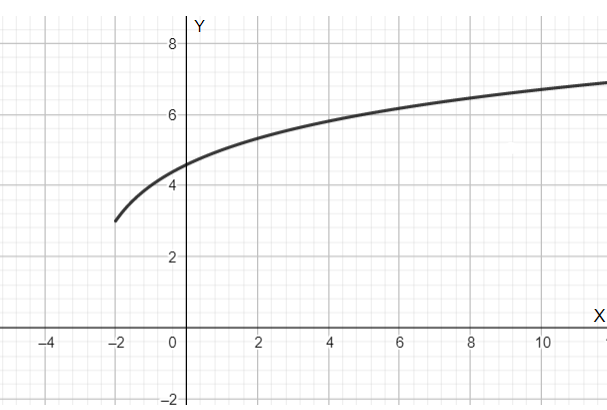
Here, we can see that the projection of the function along the X-axis originates from the point, $x=-2$ and goes to infinity and for this the projection along the X-axis, the value of the function along the Y-axis changes from, $y=3$ to infinity.
Thus, the domain of the given graphical representation of a function is equal to:
$\Rightarrow D\left[ f \right]=[-2,\infty )$
Hence, the domain of the function comes out to be, $x\ge -2$ .
So, the correct answer is “Option B”.
Note: One should not confuse between the domain and range of a function. One simple way to remember them is, the domain of a function is the set of all the numbers that is acceptable to the function (input) and range of a function is the set of all numbers produced by a function for this domain (output).
Complete step by step answer:
We have been given the graphical representation of a function in the problem. So, in order to find the domain of the given graphical representation, we will find all the points of projection of the graph on the X-axis and collect them all in a set.
Let us draw the diagram of the function as follows:
Here, we can see that the projection of the function along the X-axis originates from the point, $x=-2$ and goes to infinity and for this the projection along the X-axis, the value of the function along the Y-axis changes from, $y=3$ to infinity.
Thus, the domain of the given graphical representation of a function is equal to:
$\Rightarrow D\left[ f \right]=[-2,\infty )$
Hence, the domain of the function comes out to be, $x\ge -2$ .
So, the correct answer is “Option B”.
Note: One should not confuse between the domain and range of a function. One simple way to remember them is, the domain of a function is the set of all the numbers that is acceptable to the function (input) and range of a function is the set of all numbers produced by a function for this domain (output).
Recently Updated Pages
Master Class 12 Economics: Engaging Questions & Answers for Success
Master Class 12 Physics: Engaging Questions & Answers for Success
Master Class 12 English: Engaging Questions & Answers for Success
Master Class 12 Social Science: Engaging Questions & Answers for Success
Master Class 12 Maths: Engaging Questions & Answers for Success
Master Class 12 Business Studies: Engaging Questions & Answers for Success
Trending doubts
Which are the Top 10 Largest Countries of the World?
What are the major means of transport Explain each class 12 social science CBSE
Draw a labelled sketch of the human eye class 12 physics CBSE
Why cannot DNA pass through cell membranes class 12 biology CBSE
Differentiate between insitu conservation and exsitu class 12 biology CBSE
Draw a neat and well labeled diagram of TS of ovary class 12 biology CBSE