


Draw a graph to convert miles to kilometres, given 1 mile = 1.6 km. Use the graph to find
(i) How many kilometres are approximately equal to 4.5 miles?
(ii) How many miles are approximately equal to 8 km?
Answer
580.5k+ views
Hint: We know that 1 mile is equal to 1.6 kilometres. Let the distance in kilometres be x and the distance in miles be y, then the relation between miles and kilometres will be $ 1 = 1.6 \times m $ , where m is the slope. Find the value of the slope and substitute it in the line equation when slope and intercept are given, and then using it plot the graph.
Complete step-by-step answer:
We are given to draw a graph to convert miles into kilometres and the value of one mile is equal to 1.6 kilometres.
The line equation when a slope and y-intercept are given is $ y = mx + c $ , where m is the slope and c is the y-intercept.
Let the distance in kilometres be x and the distance in miles be y.
Then we can relate miles and kilometres as $ y = mx \to 1mile = m \times 1.6km $ , where m is the slope.
Slope is $ m = \dfrac{1}{{1.6}} = \dfrac{{10}}{{16}} = \dfrac{5}{8} $
Now, substitute the slope in the line equation where the y-intercept is zero because when the distance is zero miles, the corresponding distance in kilometres is also zero.
$
y = mx + c \\
m = \dfrac{5}{8},c = 0 \\
\Rightarrow y = \dfrac{5}{8}x + 0 \\
\Rightarrow y = \dfrac{5}{8}x \\
$
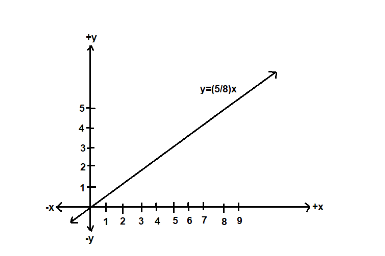
Now using the line equation $ y = \dfrac{5}{8}x $ , plot the graph.
When the value of y is 4.5 miles then the corresponding value of x in kilometers is $ 4.5 = \dfrac{5}{8}x \to x = \dfrac{{4.5 \times 8}}{5} = 7.2km $
When the value x is 8 km then the corresponding value of y in miles is $ y = \dfrac{5}{8} \times 8 \to y = 5 miles $
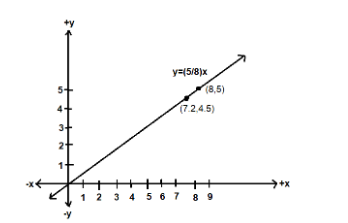
7.2 kilometres is 4.5 miles and 5 miles is 8 kilometres.
So, the correct answer is “Option C”.
Note: The slope of a line can be obtained by the ratio of change in y-coordinates to the change in x-coordinates. Slope is a constant value but it has units. The units of slope will be the ratio of y-units to the x-units. Here, the units of slope are miles per kilometres. So do not assume that the slope will not have units. Do not confuse graphs with charts as a graph is a type of chart, but not vice-versa. All graphs are charts, but all charts need not be graphs.
Complete step-by-step answer:
We are given to draw a graph to convert miles into kilometres and the value of one mile is equal to 1.6 kilometres.
The line equation when a slope and y-intercept are given is $ y = mx + c $ , where m is the slope and c is the y-intercept.
Let the distance in kilometres be x and the distance in miles be y.
Then we can relate miles and kilometres as $ y = mx \to 1mile = m \times 1.6km $ , where m is the slope.
Slope is $ m = \dfrac{1}{{1.6}} = \dfrac{{10}}{{16}} = \dfrac{5}{8} $
Now, substitute the slope in the line equation where the y-intercept is zero because when the distance is zero miles, the corresponding distance in kilometres is also zero.
$
y = mx + c \\
m = \dfrac{5}{8},c = 0 \\
\Rightarrow y = \dfrac{5}{8}x + 0 \\
\Rightarrow y = \dfrac{5}{8}x \\
$
Now using the line equation $ y = \dfrac{5}{8}x $ , plot the graph.
When the value of y is 4.5 miles then the corresponding value of x in kilometers is $ 4.5 = \dfrac{5}{8}x \to x = \dfrac{{4.5 \times 8}}{5} = 7.2km $
When the value x is 8 km then the corresponding value of y in miles is $ y = \dfrac{5}{8} \times 8 \to y = 5 miles $
7.2 kilometres is 4.5 miles and 5 miles is 8 kilometres.
So, the correct answer is “Option C”.
Note: The slope of a line can be obtained by the ratio of change in y-coordinates to the change in x-coordinates. Slope is a constant value but it has units. The units of slope will be the ratio of y-units to the x-units. Here, the units of slope are miles per kilometres. So do not assume that the slope will not have units. Do not confuse graphs with charts as a graph is a type of chart, but not vice-versa. All graphs are charts, but all charts need not be graphs.
Recently Updated Pages
Master Class 9 General Knowledge: Engaging Questions & Answers for Success
Master Class 9 Social Science: Engaging Questions & Answers for Success
Master Class 9 English: Engaging Questions & Answers for Success
Master Class 9 Maths: Engaging Questions & Answers for Success
Master Class 9 Science: Engaging Questions & Answers for Success
Class 9 Question and Answer - Your Ultimate Solutions Guide
Trending doubts
Difference Between Plant Cell and Animal Cell
Fill the blanks with the suitable prepositions 1 The class 9 english CBSE
Who is eligible for RTE class 9 social science CBSE
Which places in India experience sunrise first and class 9 social science CBSE
What is pollution? How many types of pollution? Define it
Name 10 Living and Non living things class 9 biology CBSE